Seamless air quality data storage, management, and analysis

The Clarity Cloud makes your air quality data accessible, actionable, and easy to understand. Our user-friendly platform visualizes real-time air quality sensor measurements to inform critical decisions.

Request a Demo
Access pollutant data via the Clarity Dashboard and Clarity OpenMap web apps, or retrieve measurements and sensor data using Clarity’s REST API.

Our Data Promise

We take data security, ownership, and democracy seriously at Clarity. Here are the four pillars of our data policy we will stand by no matter what.

You own your data

Clarity does not “co-own” your data. You are the sole owner of your data.

No one else owns 
your data

Clarity will never share your data with third parties without your consent.

All data are included

No black boxes. Everything that your Node-S and modules measure, you see.

Easy to share

If you choose to, make your data public on Clarity OpenMap for easy sharing.

Request a Demo
Effortlessly oversee your device fleet's health and status. Identify offline or unresponsive devices, pinpoint sensor issues, and troubleshoot efficiently using our comprehensive guides

A modern cloud-first air quality monitoring solution

Clarity’s managed data infrastructure removes the complexities of wrangling raw air quality measurements into actionable environmental insights.

As your air quality measurement devices sample the air, measurements are continuously uploaded to the Clarity Cloud via cellular networks. Our cloud architecture handles all aspects of your air quality data transmission, validation, storage, and processing so you don't have to maintain servers or build pipelines.

It’s all in the Dashboard

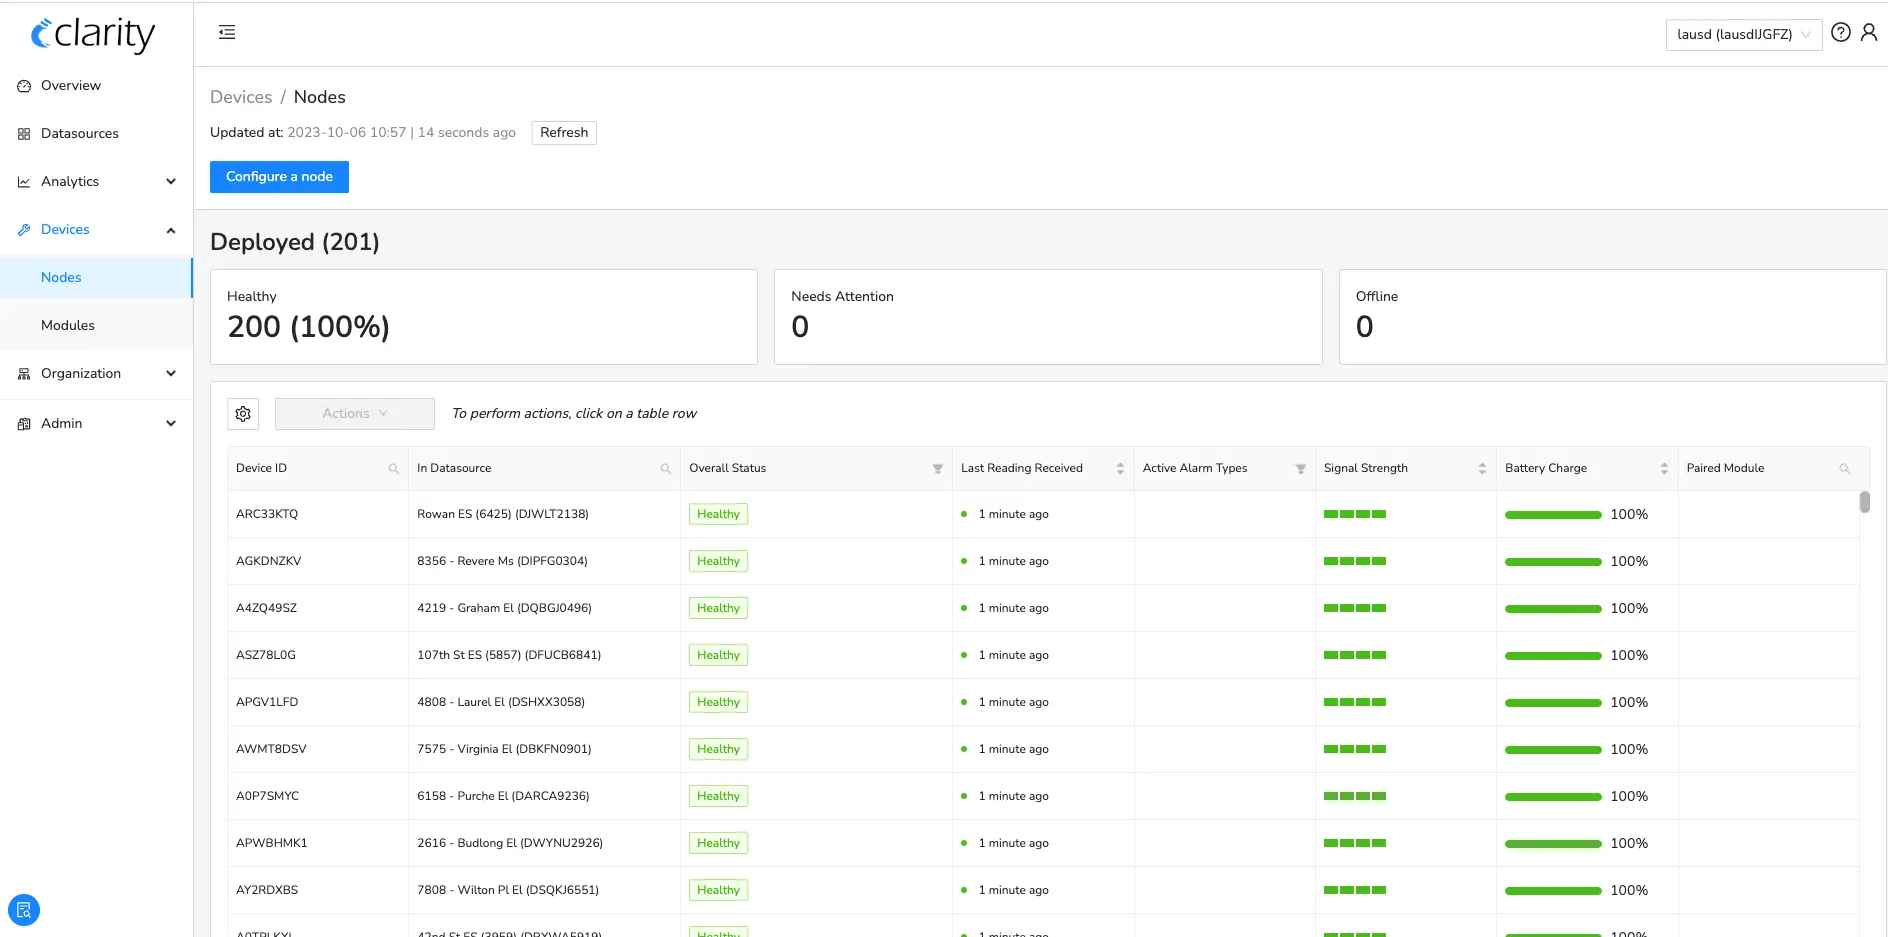
After deployment is complete, you’ll have complete access to your devices through the Clarity Dashboard, a private air quality data visualization and device management web app that makes managing your air quality monitoring network easy. Built-in status alerts, interactive maps, and downloadable reports give you the tools you need to run a successful air measurement network. 

You’ll also be able to visualize air pollutant levels, view air quality trends, and configure devices or access measurements programmatically for custom integrations. The Clarity Dashboard is built for real-time data exploration and decision-making, and with instant access to validated data, you can rapidly identify issues as they emerge.

Learn more about the Dashboard
Our dedicated collocation reporting view provides valuable metrics like R2, MAE, time series, scatter plots, and more, helping you ensure data quality objectives are met.
The Clarity Dashboard is a private air quality data visualization and management web app. Users log in with their unique account credentials to manage air quality monitors and view, plot, and download current and historical raw and calibrated data.

Leverage Clarity's Air Monitoring API to integrate your air quality data anywhere

The Clarity Cloud is built API-first, meaning that all of your air quality measurements and network management data are easily accessible via Clarity's Air Monitoring API. Our well-documented and religiously maintained API simplifies the integration process, allowing you to seamlessly integrate real-time air quality information into your applications and services. 

See the API Guide

Leverage Clarity's Air Monitoring API to integrate your air quality data anywhere

The Clarity Cloud is built API-first, meaning that all of your air quality measurements and network management data are easily accessible via Clarity's Air Monitoring API. Our well-documented and religiously maintained API simplifies the integration process, allowing you to seamlessly integrate real-time air quality information into your applications and services.

Request a Demo

Access the API

Build custom software accessing device data through our API. Integrate air quality into any system or application.

Stay secured

Enterprise-grade encryption secures data at rest and in transit. Data security is ensured through the verification of authentic device data, secure cloud storage with protection against snooping, and encrypted data access, leveraging the capabilities of Amazon Web Services.

Visualize your data
with OpenMap

Our optional public platform visualizes PM2.5 and Air Quality Index (AQI) data from Clarity's rigorously calibrated sensors, alongside vetted government reference monitors. Get hourly NowCast AQIs, daily and monthly averages, and more, all with complete transparency on data sources and methodology.

  • View, plot, and share data in an open repository
  • Embed in public websites using iFrame
  • Access seasonal data overlays
Learn more about OpenMap
Snapshot of Clarity OpenMap, Clarity's public map of real-time air pollution levels. Read more.

Alexander Larcombe

Associate Professor and Program Head of Respiratory Health, Telethon Kids Institute

Having a larger network of sensors where we have a better resolution of where air pollution is worse or better will be beneficial in allowing us to change behaviors, educate people more, or do all sorts of things to improve the health of those people

Read Customer Story

Begaim Alipova

Head of Atmospheric Pollution Observation Division, Kyrgyzhydromet

"In 2020, we installed 50 sensors in the city of Bishkek. Since the Clarity Node-S sensors installed in Bishkek are small, we installed them all over the city. We placed some of them near roads, some in residential areas, and some in social facilities. Thanks to the Global SIM Card which is incorporated in the sensors, we get the data directly to our system which allows us to visualize the data. The data is ready for analysis.”

Read Customer Story

Bolat Amirgaliyev

Head of Environment Division, EcoAlmaty

"Today we have 50 Clarity sensors in Almaty that provide us with online data on the type of particles and pollution in different parts of the city. Thanks to these sensors, we can plan environmental measures in Almaty.”

Read Customer Story

Carlos A. Torres

Director of LAUSD's Office of Environmental Health and Safety

“The Know Your Air Network provides us with vital air quality information that can be used to inform real-time decisions to protect the health and well-being of our school communities. This air quality sensor network is unparalleled in its size and scope, demonstrating Los Angeles Unified’s commitment to providing the safest learning environment for our students.”

Read Customer Story

Carlos Torres

Director of the Office of Environmental Health and Safety, Los Angeles Unified School District

"People want to know what’s really happening with their local air quality. The ability to have an answer back to students, parents, and teachers within seconds is invaluable."

Read Customer Story

Providing secure air quality data for organizations like:

Request a Clarity Cloud Demo

Thank you! Your submission has been received!
Oops! Something went wrong while submitting the form.

Can’t find the resource you need?

Contact Us