Air quality data visualization and air sensor network management made easy

The Clarity Dashboard makes air quality data accessible, actionable, and easy to understand. Our user-friendly, cloud-based platform visualizes real-time air pollution sensor measurements to inform critical decisions and provides you with all the tools you need to manage your air quality sensor network.

Get a Dashboard demo
Simplify air quality data visualization and sensor network management with the Clarity Dashboard. Access real-time air pollution measurements, interactive maps, and customizable reports for informed decision-making. Explore features, security, and collaboration options with Sensing-as-a-Service.

How does the Dashboard work?

The Clarity Dashboard simplifies air quality data visualization and sensor network management. After kicking off your project, you will create your Dashboard account and sign in securely to access your organization resources and start configuring your Node-S devices and modules.

Once your Node-S and Modules are configured, air quality readings are immediately transmitted via the reliable 3G/4G LTE cellular network to the Clarity Cloud, where your air quality measurements and device telemetry can be securely access via the Clarity Dashboard.

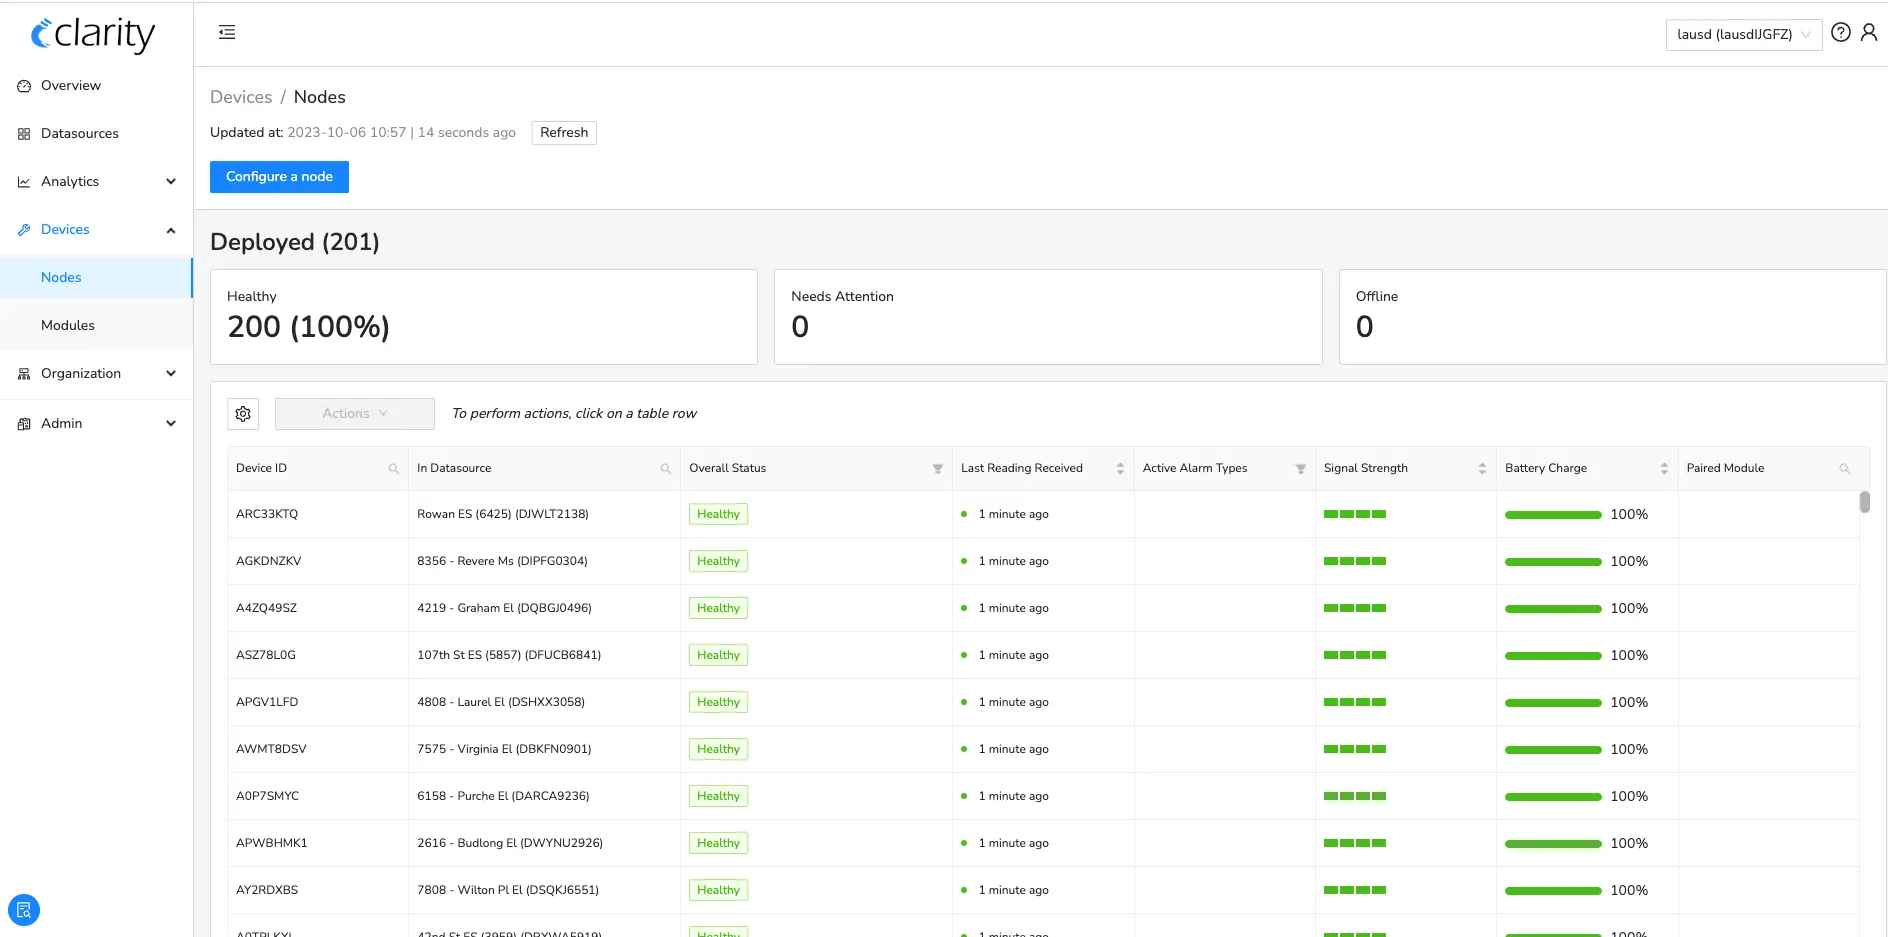
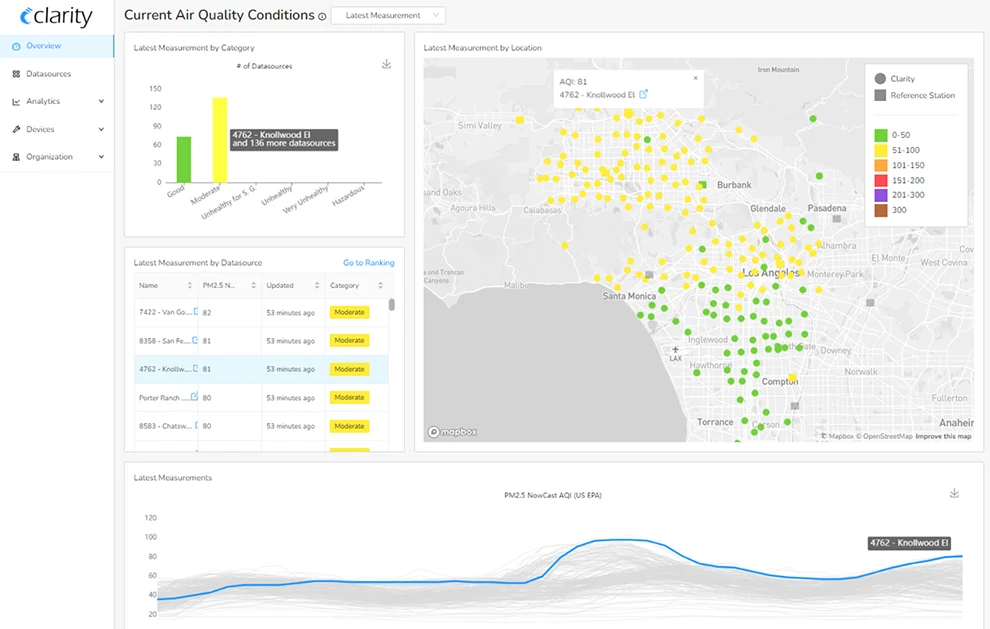
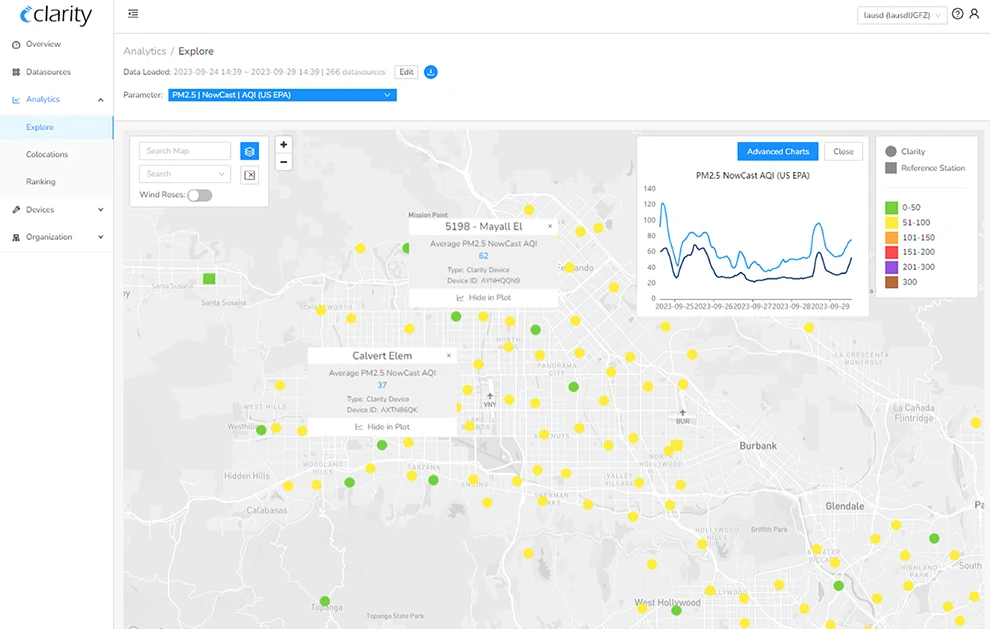
  • Instantly access real-time air quality measurements and device status reports with a suite of no-code data visualization and analysis widgets
  • ‍Invite colleagues to join your organization for seamless collaboration
  • Integrate with our system via API to enhance functionality
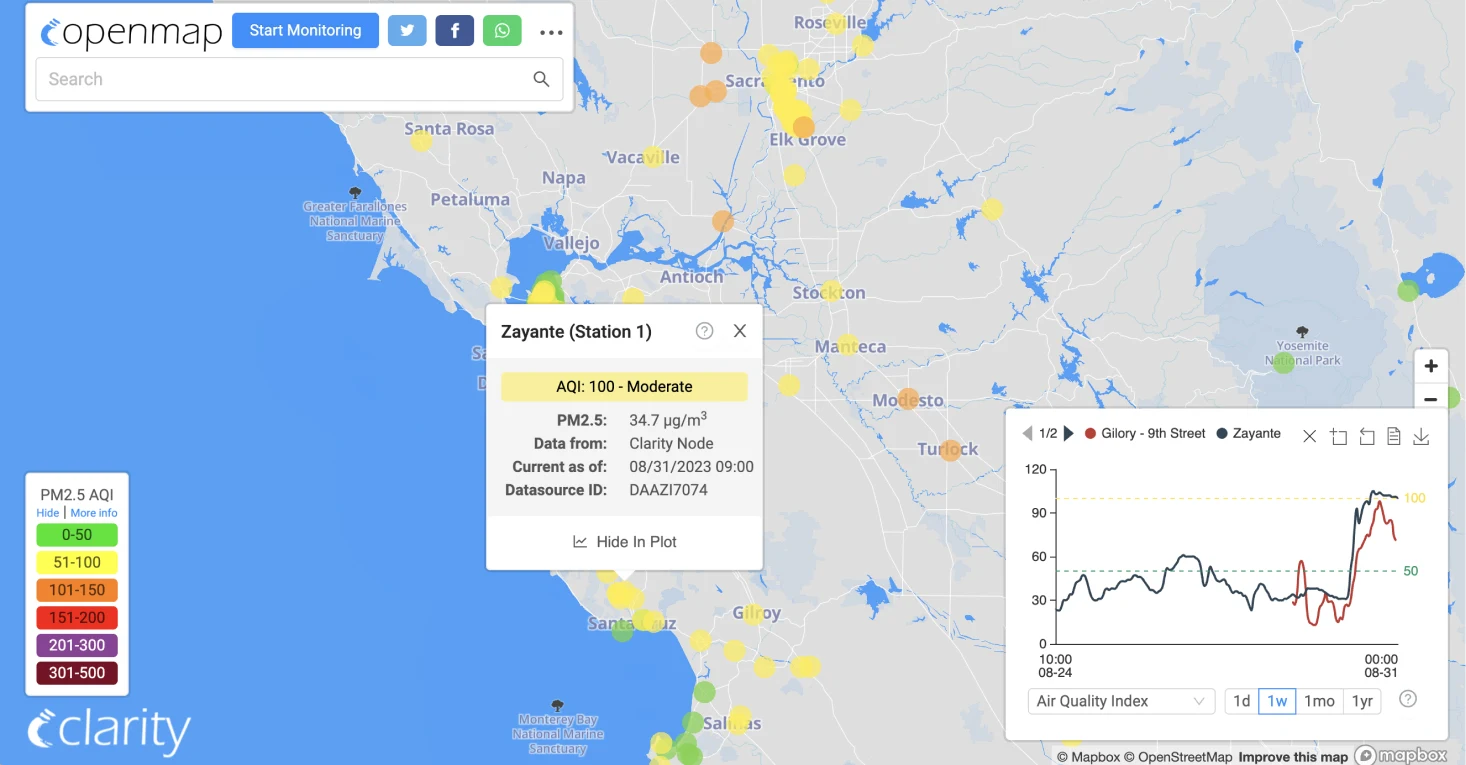
  • Optionally share air quality data publicly through Clarity OpenMap and Opendata API

There are no extra costs associated with the Clarity Dashboard. Sensing-as-a-Service covers cellular connectivity, data storage, and web app access, ensuring a hassle-free experience.

Get a Dashboard Demo
Effortlessly oversee your device fleet's health and status. Identify offline or unresponsive devices, pinpoint sensor issues, and troubleshoot efficiently using our comprehensive guides

Our Data Promise

We take security, ownership, and democracy seriously at Clarity. Here are the four pillars of our data policy we will stand by no matter what.

You own the data

Clarity does not “co-own” your data. You are the sole owner of your data.

No one else owns 
the data

Clarity will never share your data with third parties without your consent.

All data are included

No black boxes. Everything that your Node-S and modules measure, you see.

Easy to share

If you choose to, make your data public on Clarity OpenMap for easy sharing.

Get a Dashboard Demo

Explore Clarity Dashboard features

Get an instant overview of the air quality conditions at your project site. View real-time data, check recent measurements, investigate outlier sites, and respond swiftly to changing conditions.

Air Quality Snapshot

Get an instant overview of the air quality conditions at your project site. View real-time air quality data, check recent air pollution measurements, investigate outlier sites, and respond swiftly to changing conditions.

Effortlessly oversee your device fleet's health and status. Identify offline or unresponsive devices, pinpoint sensor issues, and troubleshoot efficiently using our comprehensive guides

Device Management and Status Tracking

Effortlessly oversee your device fleet's health and status. Identify offline or unresponsive devices, pinpoint sensor issues, and troubleshoot efficiently using our comprehensive guides. If needed, contact Clarity for a prompt device replacement.

Dive into data exploration with ease. Compare measurements across different locations, customize time periods and aggregations, and export ready-to-present charts for sharing insights with stakeholders

Explore and Download Data

Dive into data exploration with ease. Compare measurements across different locations, customize time periods and aggregations, and export ready-to-present charts for sharing insights with stakeholders. Focus your analysis on specific areas and timeframes, and export .csv datasets for further advanced analysis in your preferred tools.

As you enhance your monitoring network with specialized modules for monitoring additional parameters, you unlock advanced visualizations like Wind Roses on Dashboard

Advanced Air Quality Visualizations

As you enhance your air quality monitoring network with specialized Modules for monitoring additional air quality parameters, you unlock advanced visualizations like Wind Roses on the Dashboard. These tools empower you to tackle increasingly complex air pollution questions and take targeted actions to improve air quality.

Understand how your air quality sensors are performing relative to reference monitoring equipment. Our dedicated collocation reporting view provides valuable metrics like R2, MAE, time series, scatter plots, and more, helping you ensure data quality objectives are met.

Accuracy Reporting for Collocated Devices

Understand how your air quality sensors are performing relative to reference monitoring equipment. Our dedicated collocation reporting view provides valuable metrics like R2, MAE, time series, scatter plots, and more, helping you ensure your data quality objectives are met.

Stay informed about your devices' health and measurements. Receive alerts when a device goes offline, becomes unresponsive, or encounters sensor issues. Define custom thresholds and rules to trigger notifications when specific measurements or combinations of measurements exceed predefined limits.

Custom Device Status and Measurement Alarms

Stay informed about your devices' health and measurements. Receive alerts when a device goes offline, becomes unresponsive, or encounters sensor issues. Define custom thresholds and rules to trigger notifications when specific air pollution measurements or combinations of measurements exceed predefined air quality limits.

User and Data Access Management

Manage your organization's users with precision. Assign roles with varying permissions: Org Admins oversee projects, Technicians handle device deployment and maintenance, Analysts focus on data exploration, Observers have read-only access to resources, and Guests can view a subset of the organization's datasources. Additionally, add applications to your organization and control their permissions to enable automation.

Integration with Existing Systems

Embrace our API-first approach, allowing you to access all Dashboard information via our Air Monitoring API. Leverage this capability to seamlessly integrate with your existing systems, facilitating streamlined operations and data sharing. Explore our detailed
API guide for more details.

Enabling air quality measurement for organizations like:

OpenMap

Our optional public platform visualizes PM2.5 and Air Quality Index (AQI) data from Clarity's rigorously calibrated sensors, alongside vetted government reference monitors. Get hourly NowCast AQIs, daily and monthly averages, and more, all with complete transparency on data sources and methodology.

  • View, plot, and share data in an open repository
  • Embed in public websites using iFrame
  • Access seasonal data overlays
Learn more about OpenMap
Clarity OpenMap, public OpenMap platform visualizes PM2.5 and Air Quality Index (AQI) data from Clarity's rigorously calibrated air quality sensors alongside vetted government reference monitors

Hear what our customers say about our dashboard

Jyrgalbek Shamyraliev

Vice-Mayor, Bishkek City Mayor’s Office

"The data provided by the sensors helped to speed up the city’s decision-making. Today, the sensor readings have had a direct impact on public opinion. This year, we launched public ecological transport and eco-taxi, and we are launching a new system of dedicated public transport lanes that will directly affect the transition to eco-friendly modes of transportation.”

Read Customer Story

Begaim Alipova

Head of Atmospheric Pollution Observation Division, Kyrgyzhydromet

"In 2020, we installed 50 sensors in the city of Bishkek. Since the Clarity Node-S sensors installed in Bishkek are small, we installed them all over the city. We placed some of them near roads, some in residential areas, and some in social facilities. Thanks to the Global SIM Card which is incorporated in the sensors, we get the data directly to our system which allows us to visualize the data. The data is ready for analysis.”

Read Customer Story

William Chevalier

Supervising Air Monitoring Specialist, Monterey Bay Air Resources District

"We are very happy with the Dashboard — it makes it very easy to access and review data from our network."

Read Customer Story

Eddie Ahn

Executive Director, Brightline Defense

"Clarity’s team helped facilitate our understanding of the air quality space as a whole. We are now checking in with the Clarity team about once a month to touch base about the network and learn how to use the Clarity Dashboard. Having all of our data available in a secure web portal is very useful, especially as we prepare data reports. Brightline wants to make sure we can take all these data streams and analyze them to highlight important air quality issues that the community should know about."

Read Customer Story

What else is included with Sensing-as-a-Service?

Clarity Dashboard access is part of Clarity's Sensing-as-a-Service offering, which includes:

Hardware -
Hardware

Easily deployed air monitoring devices

Self-powered Clarity Node-S air quality monitoring hardware measures PM2.5 and NO2 and serves as a platform for additional modules that measure Wind, Black Carbon, and Ozone. Rugged and with minimized maintenance requirements, our devices reduce installation and field intervention costs.

Explore our devices
Clarity's user friendly air quality management dashboard - Learn more
Cloud

Cloud data management & visualization

Air quality measurements and air sensor network status are easily accessible in real-time via Clarity’s user-friendly Dashboard, REST API, and OpenMap. No matter your level of experience, we have a solution to help you and your project’s stakeholders to get the most out of your data.

Learn more about Clarity Cloud
Dedicated Environmental Project Manager to help you with your Air Quality Management project. Learn more.
Support

Expert air quality project support

Air quality monitoring is hard, but we can help. You’ll partner with an experienced Environmental Project Manager to help you define a project plan and guide you through Collocation and Calibration of your devices. You’ll receive support throughout the duration of your project, with recurring meetings and check-ins to ensure data quality. 

Meet our team

Request a Dashboard Demo

Thank you! Your submission has been received!
Oops! Something went wrong while submitting the form.

Can’t find the resource you need?

Contact Us