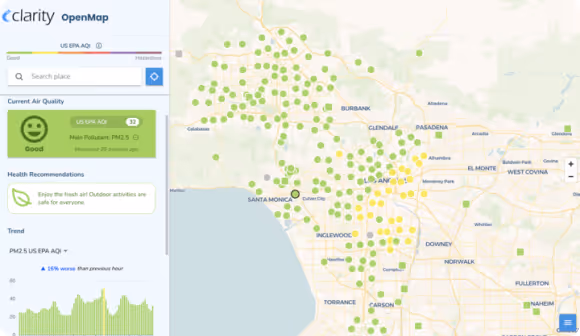
Share your air quality data publicly with OpenMap
Share real-time, accurate air quality data with your community through OpenMap to build trust, foster transparency, and drive meaningful environmental action. Empower your stakeholders with intuitive, localized insights to protect their health and keep them informed about their environment. By bridging the gap between your organization and the community, OpenMap transforms data into real-time air quality information and actionable knowledge.
OpenMap visualizes PM2.5 and NO2 Air Quality Index (AQI) data from Clarity's rigorously calibrated Node-S air quality sensors alongside government reference monitors.
Two ways to share your air quality data publicly
At Clarity, we believe in transparency and accessibility. That’s why OpenMap is included free of charge with Sensing-as-a-Service, enabling you to share your air quality data on our Clarity-branded map at no additional cost. For organizations looking to amplify their impact, OpenMap Plus offers enhanced features, including customizable branding, while remaining completely free for the public to access.
Regardless of whether you choose OpenMap or OpenMap Plus, sharing your sensor data is always optional — your data, your choice. And rest assured, there is never any cost to community members or end-users to access air quality data on either OpenMap or OpenMap Plus.
OpenMap
We value open data and transparency, which is why OpenMap will always be free to our Sensing-as-a-Service customers.
Your data on the global Clarity air quality map
Real-time air quality data updated hourly
Simple embedding options for public websites
Real-time air quality widget builder
Effortlessly share live data to social media
User-selectable AQI options (coming soon)
OpenMap Plus
Take control of your air quality data with enhanced features and custom branding to show your organization's commitment to clean air.
Everything included in OpenMap
Bespoke map focused entirely on your data
Custom branding to highlight your organization
Modifiable AQI-based health recommendations
Email alerts when air quality gets unhealthy
Data download widget for students and scientists
Expert engineering support for web integrations
Self-service configuration tools (coming soon)
OpenMap: Easily share your air quality data publicly, at no additional cost
OpenMap is our free platform designed to promote the transparency and accessibility of air quality data. Clarity customers always retain full ownership of their data, and air quality measurements will only be shared publicly if you choose to opt-in to public data sharing — whether it’s through OpenMap, or our open data partners like OpenAQ and the EPA. With a simple checkbox in the Clarity Dashboard, you can decide to share your sensor data on Clarity’s global OpenMap, empowering communities and researchers with open air quality data. Embed the map on public websites so your stakeholders can track trends with real-time and historical AQIs updated hourly — all in an easy-to-use, intuitive format.
Full ownership of your air quality data, whether or not you share it publicly
Share your air quality measurements on Clarity’s global map
Share your data with open data partners like OpenAQ and the EPA
Use iFrame embedding to display live air quality data directly on public websites
Easily create custom, dynamic, live air quality widgets to embed on your website
Data is updated hourly to communicate real-time air quality conditions
Build trust with insights into data sources, AQI readings, and health recommendations
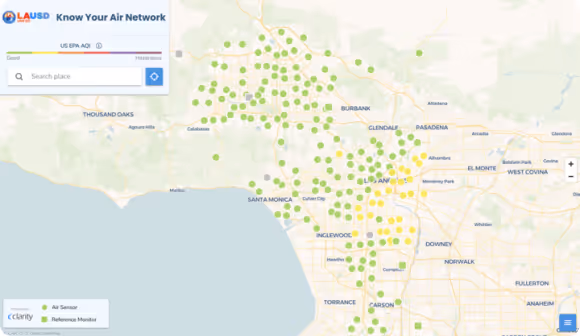
OpenMap Plus: Create a custom air quality map for your organization
OpenMap Plus lets you take control of how you showcase your air quality data with advanced customization options and branding tailored to your organization. Build a custom map bounded to your network and focused on your air quality data. Unlock powerful tools like custom AQI health recommendations, data download for citizen scientists and researchers, email notifications for your community, and engineering support for seamless integrations. With OpenMap Plus, you’re in control of how your data makes an impact.
Access all the features of OpenMap, plus exclusive enhancements
Add your organization’s branding and logo for a professional, tailored look
Focused data presentation with a map tailored specifically to your network
Choose which country’s AQI to display and which pollutants to show or hide
Opt-in email notifications keep your audience informed of air quality changes
Empower users with the ability to download air quality data directly from your map
Access expert assistance for seamless integrations and advanced setup
Configure and manage your map with intuitive customization tools (coming soon)
Contact Clarity for OpenMap Plus pricing
Contact us today to schedule a consultation and learn more about how OpenMap Plus can benefit your project.
Built for frictionless air quality data access
.webp)

Why Sensing-as-a-Service℠ for air pollution monitoring?
No separate software purchase. No add-on warranties. No unexpected expenses. With one upfront service, we’re giving you the affordability, flexibility, and autonomy to eliminate all of your air quality blind spots.

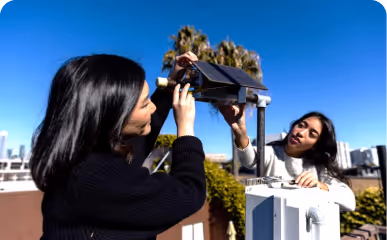
Easily deployed air monitoring devices
Self-powered Clarity Node-S air quality monitoring hardware measures PM2.5 and NO2 and serves as a platform for additional modules that measure Wind, Black Carbon, and Ozone.
Explore our devices
Cloud data management & visualization
Air quality measurements and air sensor network status are easily accessible in real-time via Clarity’s user friendly Dashboard, REST API, and OpenMap.
Learn more about Clarity CloudExpert air quality project support
Meet our teamAn experienced Environmental Project Manager to help you define a project plan and guide you through Collocation and Calibration of your devices.
Frequently Asked Questions
Clarity OpenMap is a public, interactive map that displays real-time air quality data from Clarity’s sensor networks and regulatory monitors. Anyone with internet access can use it — no login or special software required. It's designed to make air pollution data transparent and accessible for communities, researchers, and policymakers.
OpenMap shows real-time concentrations of pollutants like PM₂.₅ and corresponding Air Quality Index (AQI) values. Data comes from calibrated Clarity sensors and verified regulatory monitoring stations. Each source is clearly labeled so users can understand where the data is coming from and how it’s been processed.
Yes — OpenMap is global in scope and continuously updates with near real-time data from active Clarity deployments and select official monitors. Whether you're checking air quality in your neighborhood or another city across the world, OpenMap provides a live snapshot of pollution conditions.
Data on OpenMap is typically updated every hour using Clarity’s NowCast AQI methodology. Clarity sensor data is calibrated and quality-assured, and any third-party data is vetted before inclusion. This ensures the platform delivers highly reliable information that communities can trust.
OpenMap uses the U.S. EPA’s NowCast algorithm to convert hourly PM₂.₅ measurements into AQI values, updating the map with clear color codes (green to maroon) to show air quality conditions. This helps users interpret complex pollutant data with simple, health-relevant guidance.
Publishing data on OpenMap helps build public trust, supports transparency, and promotes community awareness. It also gives cities and organizations a professional, ready-made platform to share data with residents without needing to build their own tools, making it easy to engage the public during events like wildfire smoke or high pollution days.
OpenMap is completely free and accessible through any modern web browser — no downloads or installations required. It’s mobile-friendly and works just like a typical web map, so users can easily pan, zoom, and click on sensors to view air quality trends in their area.