“The air quality data provided by the Dashboard will serve as a foundation for designing policies, allocating budgets, and developing programs to address urban public health challenges.”
Air quality data visualization and air sensor network management made easy
The Clarity Dashboard makes air quality data accessible, actionable, and easy to understand. Our user-friendly, cloud-based platform visualizes real-time air pollution sensor measurements to inform critical decisions and provides you with all the tools you need to manage your air quality sensor network.

How does the Dashboard work?
The Clarity Dashboard simplifies air quality data visualization and sensor network management. After kicking off your project, you will create your Dashboard account and sign in securely to access your organization resources and start configuring your Node-S devices and modules.
Once your Node-S and Modules are configured, air quality readings are immediately transmitted via the reliable 3G/4G LTE cellular network to the Clarity Cloud, where your air quality measurements and device telemetry can be securely access via the Clarity Dashboard.
- Instantly access real-time air quality measurements and device status reports with a suite of no-code data visualization and analysis widgets
- Invite colleagues to join your organization for seamless collaboration
- Integrate with our system via API to enhance functionality
- Optionally share air quality data publicly through Clarity OpenMap and Opendata API
There are no extra costs associated with the Clarity Dashboard. Sensing-as-a-Service covers cellular connectivity, data storage, and web app access, ensuring a hassle-free experience.
Get a Dashboard DemoOur Data Promise
We take security, ownership, and democracy seriously at Clarity. Here are the four pillars of our data policy we will stand by no matter what.
You own the data
Clarity does not “co-own” your data. You are the sole owner of your data.
No one else owns the data
Clarity will never share your data with third parties without your consent.
All data are included
No black boxes. Everything that your Node-S and modules measure, you see.
Easy to share
If you choose to, make your data public on Clarity OpenMap for easy sharing.
Explore Clarity Dashboard features

Air Quality Snapshot
Get an instant overview of the air quality conditions at your project site. View real-time air quality data, check recent air pollution measurements, investigate outlier sites, and respond swiftly to changing conditions.
Device Management and Status Tracking
Effortlessly oversee your device fleet's health and status. Identify offline or unresponsive devices, pinpoint sensor issues, and troubleshoot efficiently using our comprehensive guides. If needed, contact Clarity for a prompt device replacement.
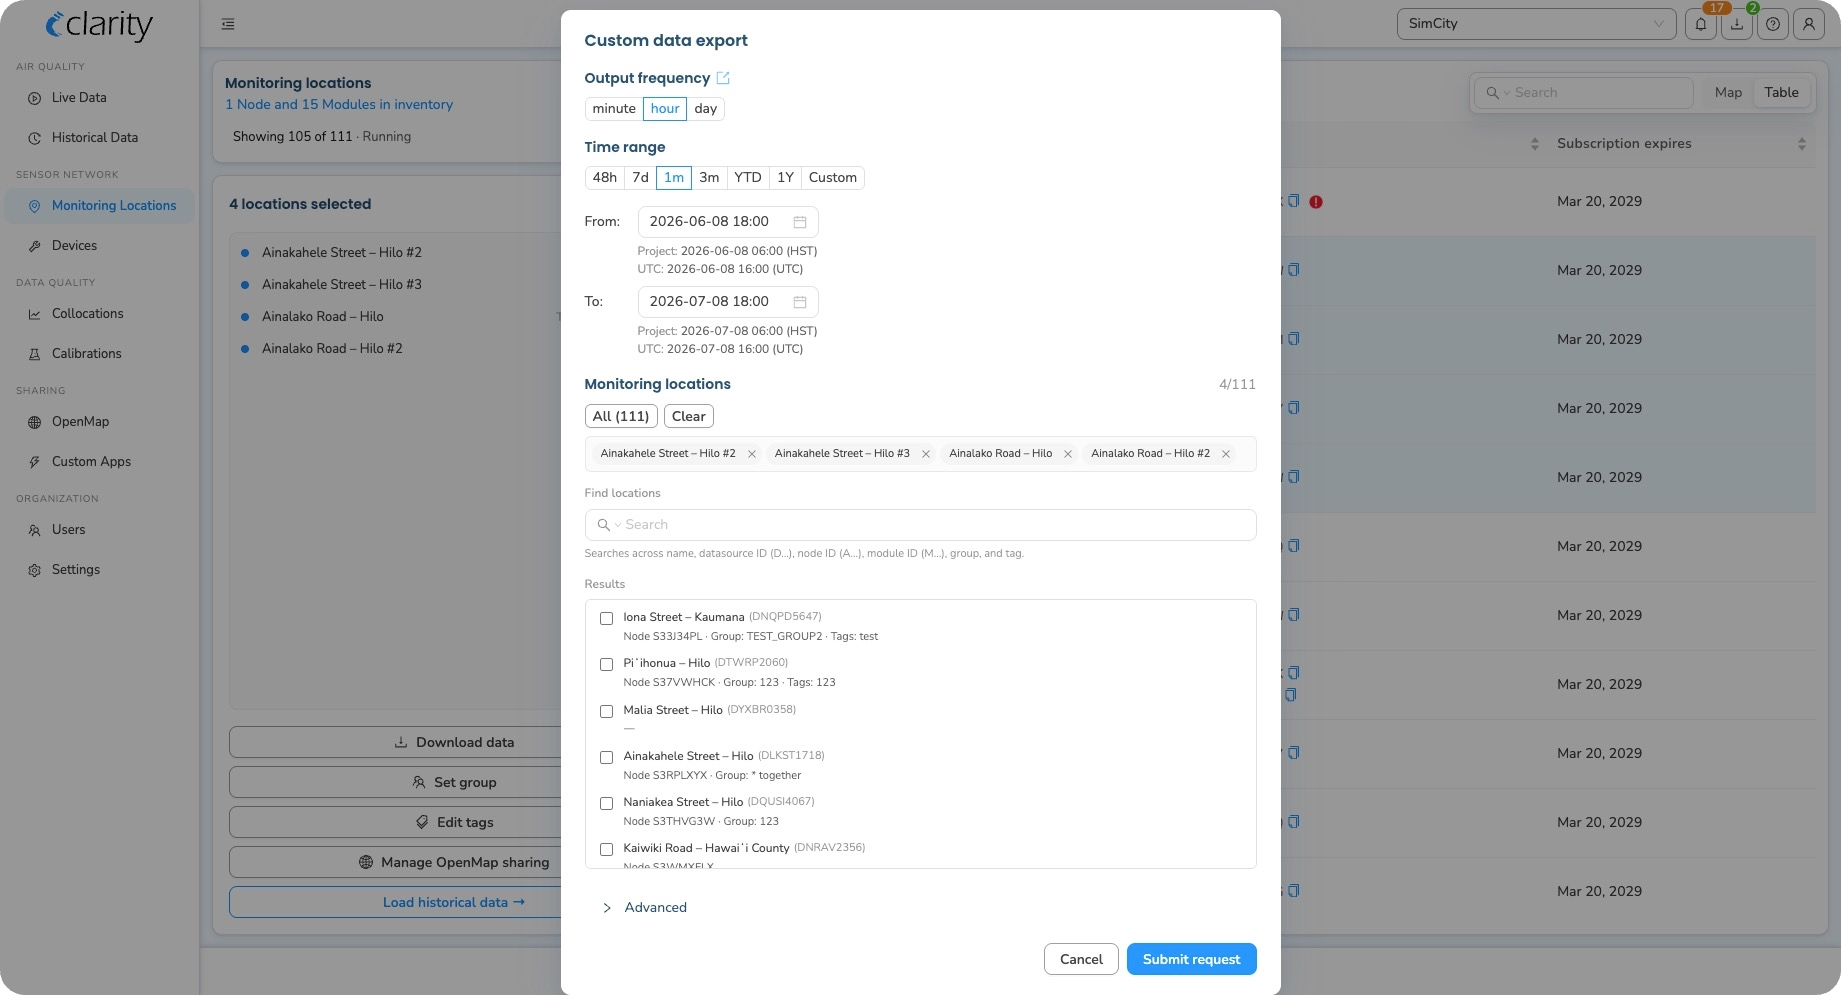
Explore and Download Data
Dive into data exploration with ease. Compare measurements across different locations, customize time periods and aggregations, and export ready-to-present charts for sharing insights with stakeholders. Focus your analysis on specific areas and timeframes, and export .csv datasets for further advanced analysis in your preferred tools.

Advanced Air Quality Visualizations
As you enhance your air quality monitoring network with specialized Modules for monitoring additional air quality parameters, you unlock advanced visualizations like Wind Roses on the Dashboard. These tools empower you to tackle increasingly complex air pollution questions and take targeted actions to improve air quality.

Accuracy Reporting for Collocated Devices
Understand how your air quality sensors are performing relative to reference monitoring equipment. Our dedicated collocation reporting view provides valuable metrics like R2, MAE, time series, scatter plots, and more, helping you ensure your data quality objectives are met.

Custom Device Status and Measurement Alarms
Stay informed about your devices' health and measurements. Receive alerts when a device goes offline, becomes unresponsive, or encounters sensor issues. Define custom thresholds and rules to trigger notifications when specific air pollution measurements or combinations of measurements exceed predefined air quality limits.
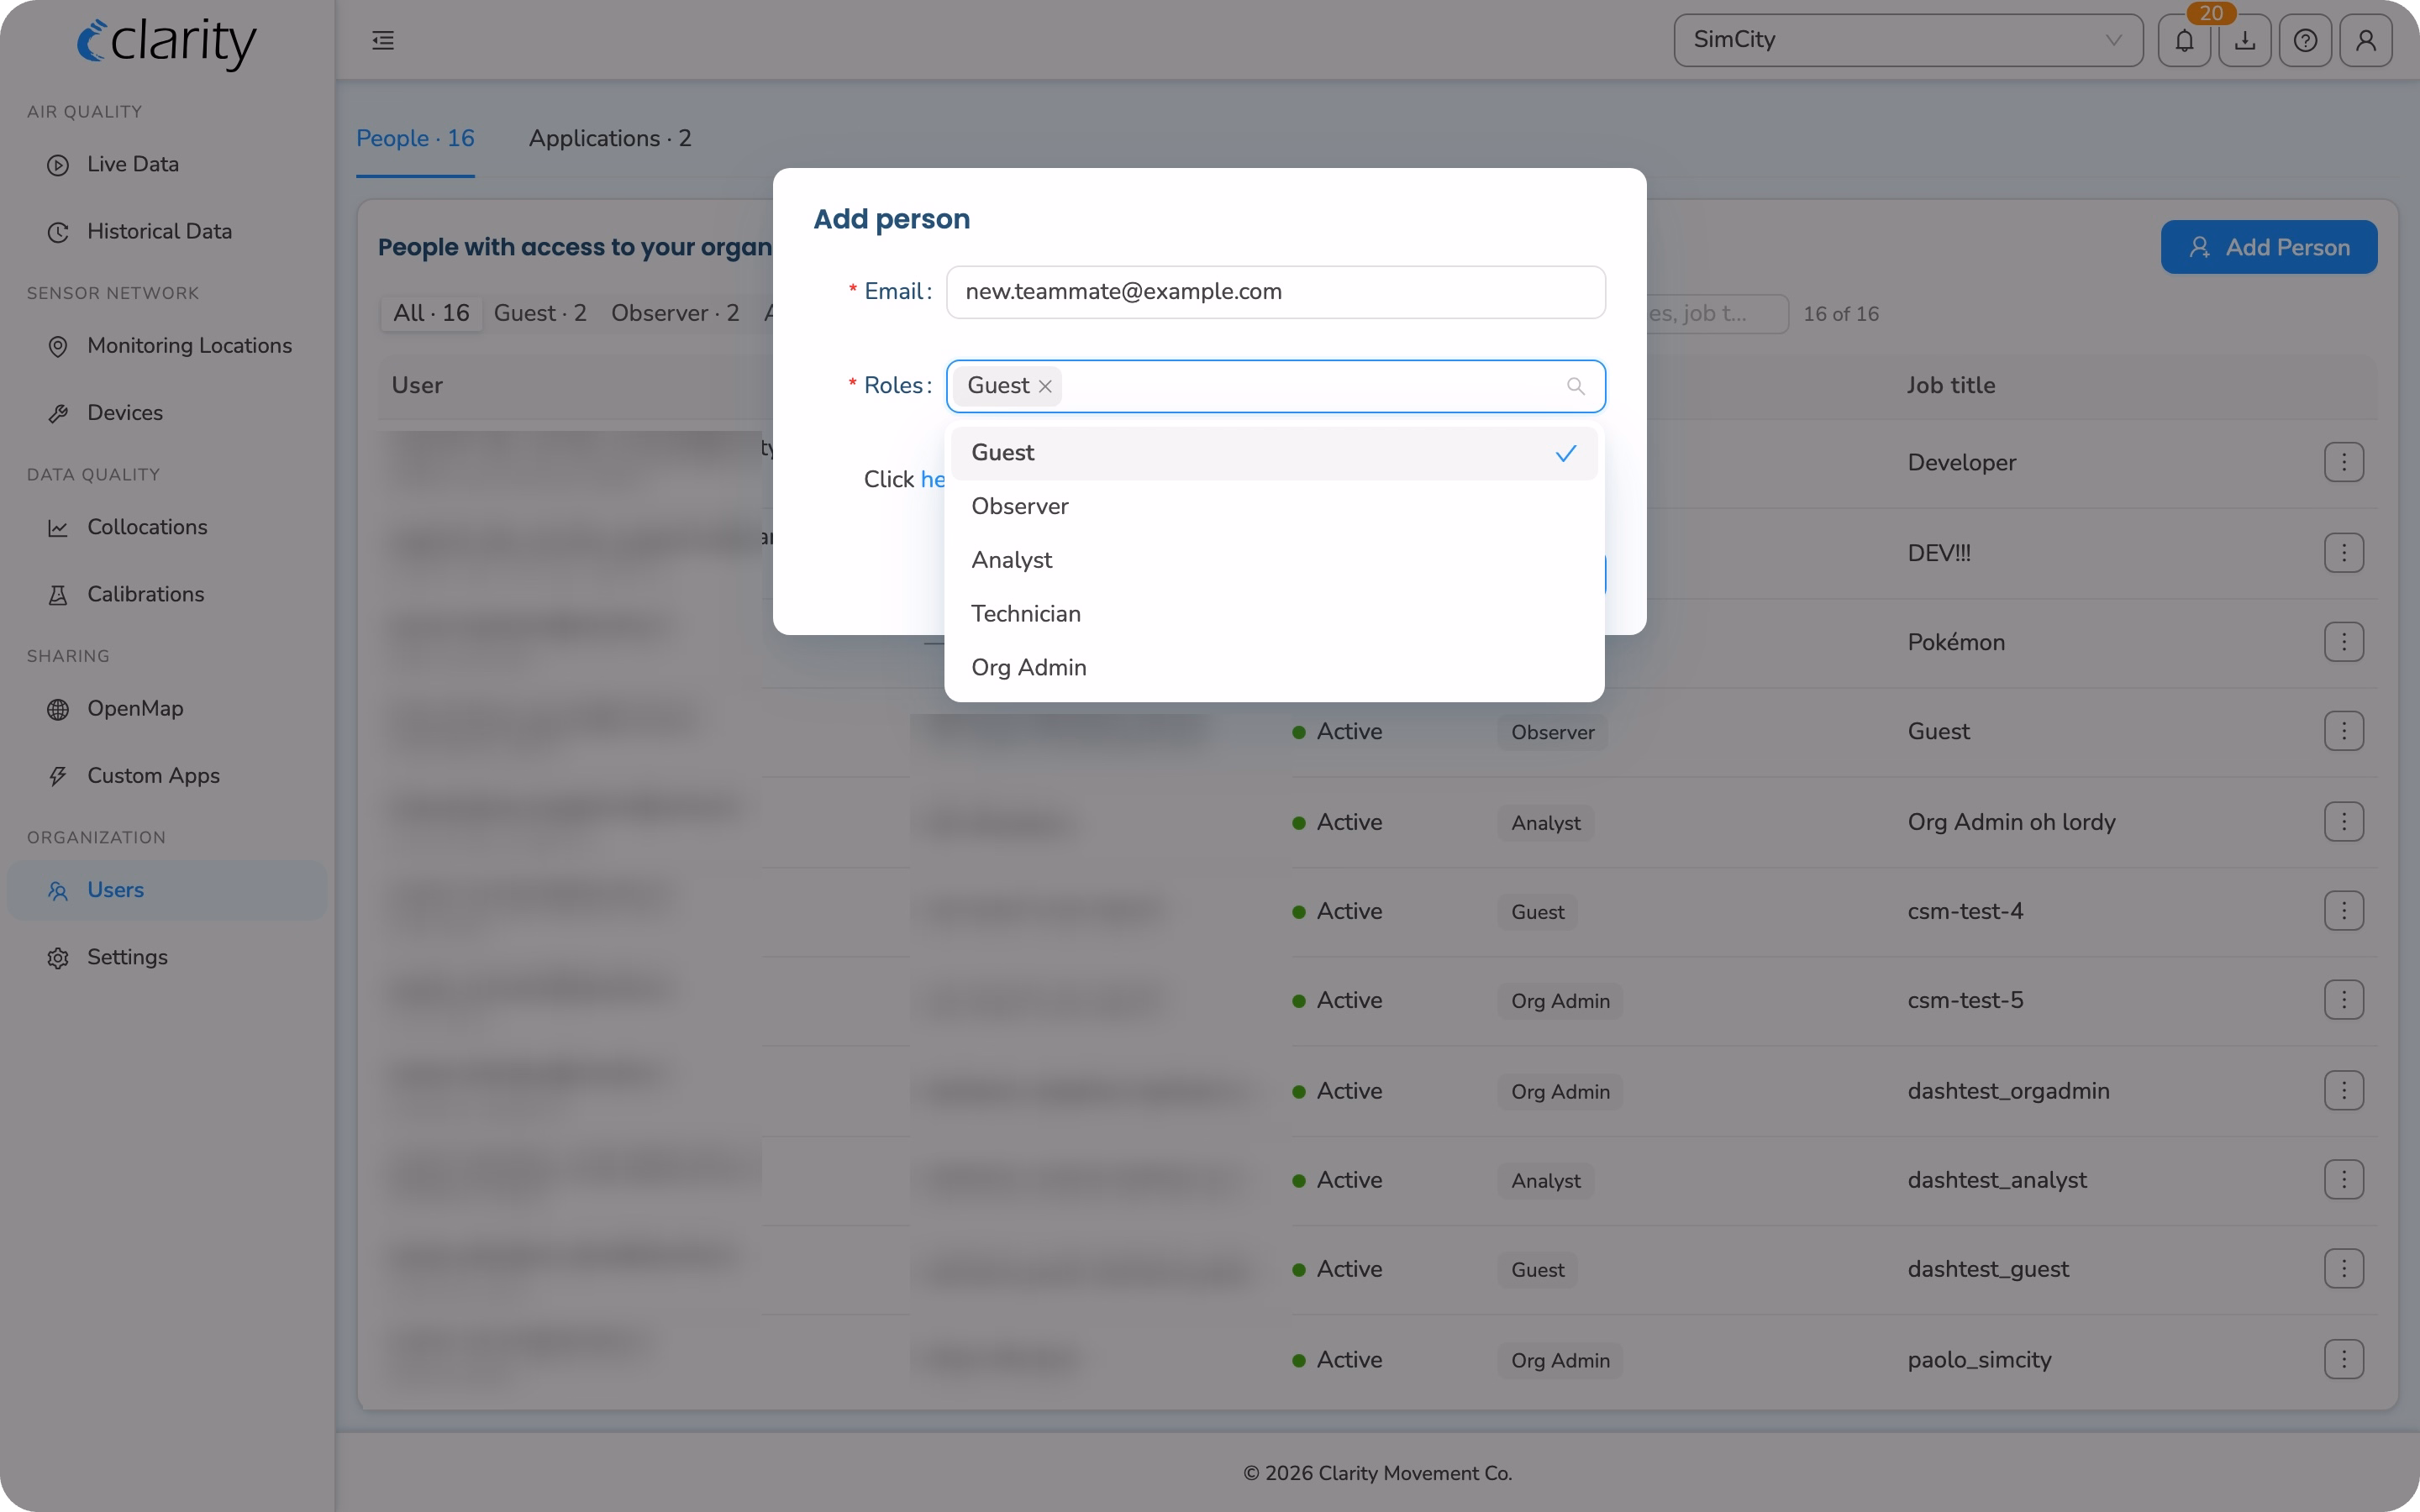
User and Data Access Management
Manage your organization's users with precision. Assign roles with varying permissions: Org Admins oversee projects, Technicians handle device deployment and maintenance, Analysts focus on data exploration, Observers have read-only access to resources, and Guests can view a subset of the organization's datasources. Additionally, add applications to your organization and control their permissions to enable automation.
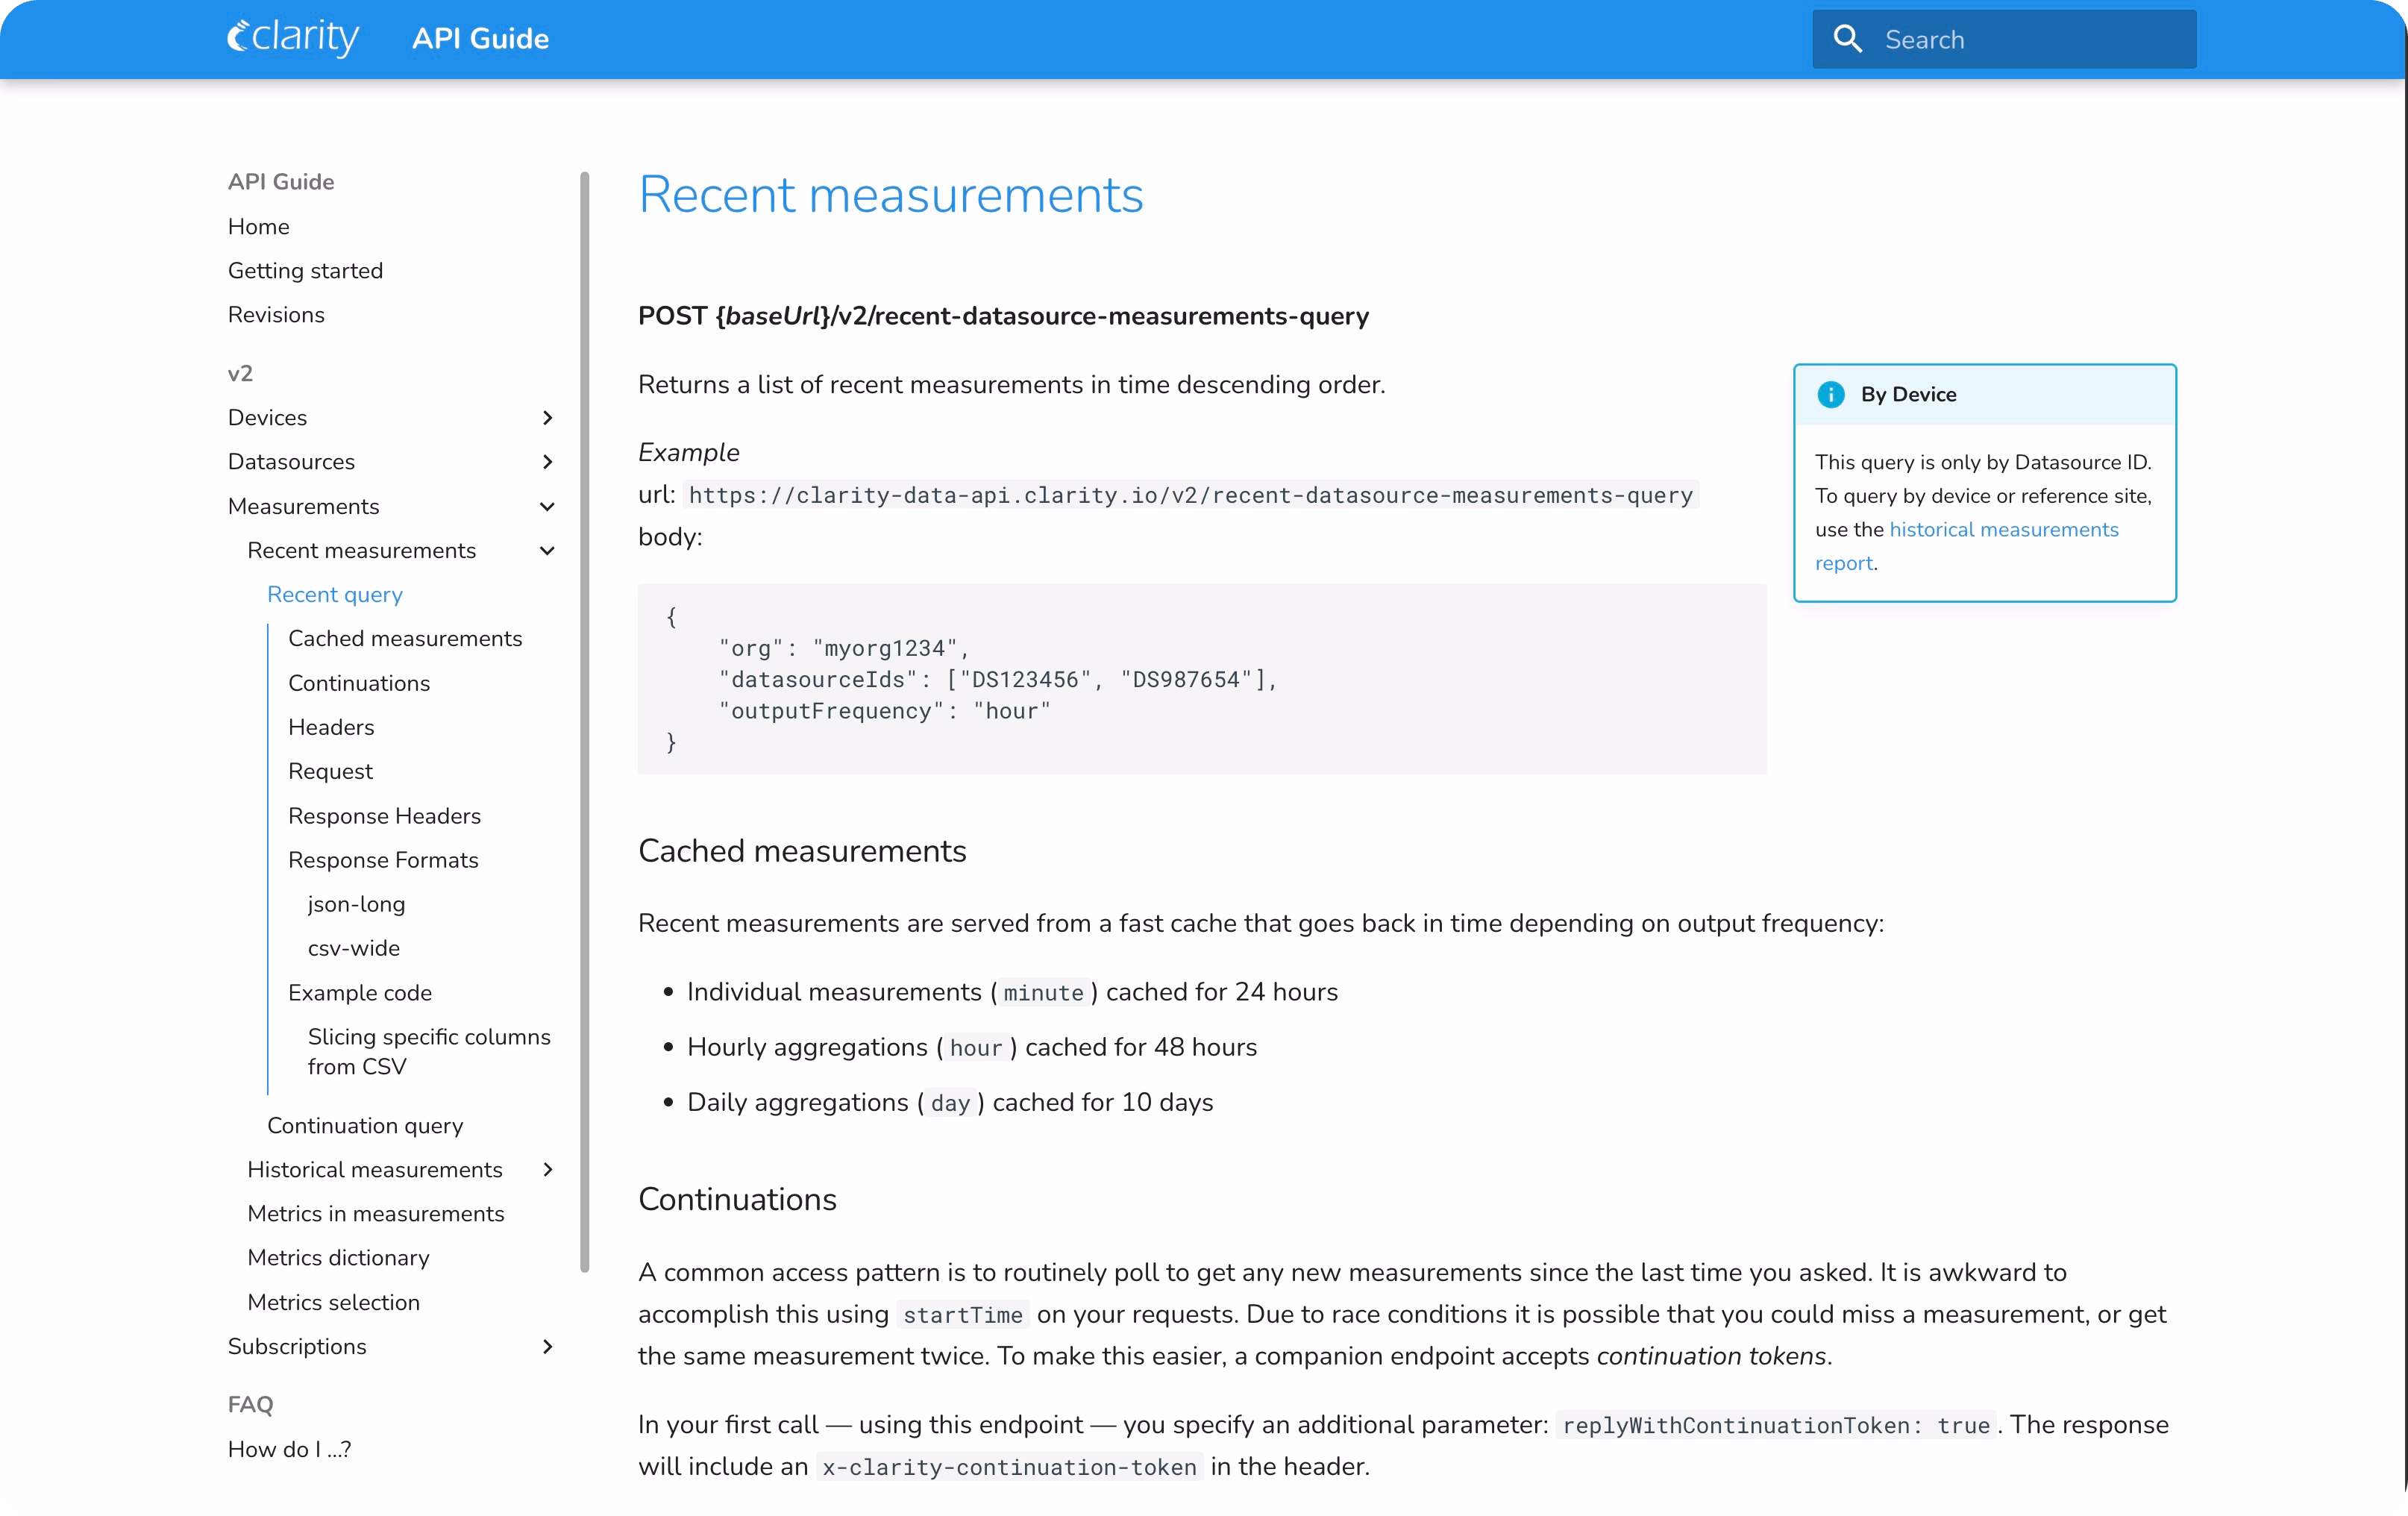
Integration with Existing Systems
Embrace our API-first approach, allowing you to access all Dashboard information via our Air Monitoring API. Leverage this capability to seamlessly integrate with your existing systems, facilitating streamlined operations and data sharing. Explore our detailed
API guide for more details.
Enabling air quality measurement for organizations like:


.png)


.png)

.webp)
OpenMap
Our optional public platform visualizes PM2.5 and Air Quality Index (AQI) data from Clarity's rigorously calibrated sensors, alongside vetted government reference monitors. Get hourly NowCast AQIs, daily and monthly averages, and more, all with complete transparency on data sources and methodology.
- View, plot, and share data in an open repository
- Embed in public websites using iFrame
- Access seasonal data overlays

Hear what our customers say about our dashboard


What else is included with Sensing-as-a-Service?
Clarity Dashboard access is part of Clarity's Sensing-as-a-Service offering, which includes:

Hardware
Easily deployed air monitoring devices
Self-powered Clarity Node-S air quality monitoring hardware measures PM2.5 and NO2 and serves as a platform for additional modules that measure Wind, Black Carbon, and Ozone. Rugged and with minimized maintenance requirements, our devices reduce installation and field intervention costs.
Explore our devices
Cloud
Cloud data management & visualization
Air quality measurements and air sensor network status are easily accessible in real-time via Clarity’s user-friendly Dashboard, REST API, and OpenMap. No matter your level of experience, we have a solution to help you and your project’s stakeholders to get the most out of your data.
Learn more about Clarity CloudSupport
Expert air quality project support
Air quality monitoring is hard, but we can help. You’ll partner with an experienced Environmental Project Manager to help you define a project plan and guide you through Collocation and Calibration of your devices. You’ll receive support throughout the duration of your project, with recurring meetings and check-ins to ensure data quality.
Request a Dashboard Demo
Thank you! Your submission has been received!
Oops! Something went wrong while submitting the form.
Frequently Asked Questions
The Clarity Dashboard is a secure, cloud-based platform where users can view and manage air quality data from their Clarity sensors. It serves as the central hub for your monitoring network, offering interactive maps, charts, sensor diagnostics, and reporting tools — all in one place. Whether you're monitoring a single location or a citywide network, the Dashboard makes it easy to access real-time insights and manage your deployment.
Yes — the Dashboard is designed to be intuitive and accessible to everyone, regardless of technical background. Clear visuals, color-coded maps, simple graphs, and built-in guidance make it easy to understand air quality conditions, track changes, and share insights with stakeholders or the public.
Absolutely. The Dashboard allows you to monitor all your sensors from a single interface, whether you have just a few or hundreds of devices deployed. You can group sensors by location or project, compare readings across sites, and get a comprehensive overview of your entire network in real time.
You can track pollutant concentrations (like PM2.5, NO₂, and ozone), analyze trends over time, compare data across locations, and detect pollution spikes as they happen. The Dashboard also gives visibility into sensor health, battery status, and network connectivity, so you’re always in control of both your data and devices.
Yes — you can set up custom alerts based on pollutant thresholds or device status (e.g., low battery or data gaps), and receive notifications via email. You can also generate downloadable reports and visual summaries for internal use or stakeholder engagement, all without needing external tools.
Yes — historical data is stored and accessible through the Clarity Dashboard, allowing you to review past pollution events, compare seasonal patterns, and generate long-term trend reports. You can filter by date range, site, or pollutant and export raw data as CSV files when needed.
With features like real-time color-coded maps, drag-and-drop time comparisons, and instant summaries, the Clarity Dashboard transforms complex data into simple visuals. It eliminates the need for external software or coding by offering built-in tools for filtering, averaging, and exporting data directly.
Definitely. The Clarity Dashboard supports multi-user access with role-based permissions. You can invite colleagues, researchers, or partners and assign different access levels — from full admin rights to read-only views — to fit your collaboration needs.
Clarity sensors use built-in cellular connectivity to transmit data to the cloud in near real time — typically within seconds to a minute. There’s no need for Wi-Fi or local networks. Once the data is received and processed, it appears instantly on the Clarity Dashboard for viewing and analysis.
You can view live status updates for each sensor, including battery level, solar charging, and connectivity. The Clarity Dashboard highlights any devices that go offline or need attention, and you can configure alerts for maintenance or unusual data behavior. Built-in QA/QC tools help you ensure your data remains accurate.
No — the Clarity Dashboard is included in the Sensing-as-a-Service subscription. There are no extra fees for software, cellular data, or storage. Everything is hosted in the cloud, updated automatically, and accessible through any modern web browser.