

Trust your air quality measurements with Clarity
This overview of Clarity Sensing-as-a-Service air quality monitoring serves as a product tour to introduce you to the essential features of your air quality measurement solution. From our air quality measurement equipment to our suite of software offerings to bespoke air quality consulting services, explore how Clarity can help you make air quality measurement simple, effective, and impactful.



Get to know your Clarity Sensing-as-a-Service air quality monitoring

Meet the Clarity Node-S: Precision air quality measurement made easy
When it comes to air quality measurement, it’s essential to start with the right tools. Clarity’s Node-S air pollution sensor is designed to provide reliable, accurate air quality data for projects of any scale.
With the Node-S, you can count on:
Unmatched Reliability
Built for long-term performance, the Node-S prevents common issues like sensor failure due to environmental factors. Each unit is rigorously tested to ensure it’s ready to deliver accurate data right from the start.
Effortless Deployment
Whether you’re deploying one device or a whole network, our intuitive setup process ensures a seamless experience. For solar-powered setups, the Node-S delivers exceptional performance and reliability.
Remote Management
Monitor and manage your network with ease using our advanced Node Management and Device Status Monitoring tools in the Clarity Dashboard. With real-time telemetry, you can avoid costly site visits and stay informed from anywhere.
Accurate Data
The Node-S is MCERTS-certified for PM2.5 and PM10, and has undergone independent evaluation by programs like AQ-SPEC. Explore our collocation results library to see how the Node-S outperforms other low-cost devices in both accuracy and reliability.
Flexible, Modular Deployment
Each Clarity Node-S can be connected with our Add-On Modules, so you can build your network to include the measurement of additional pollutants as your air quality monitoring program develops over time.
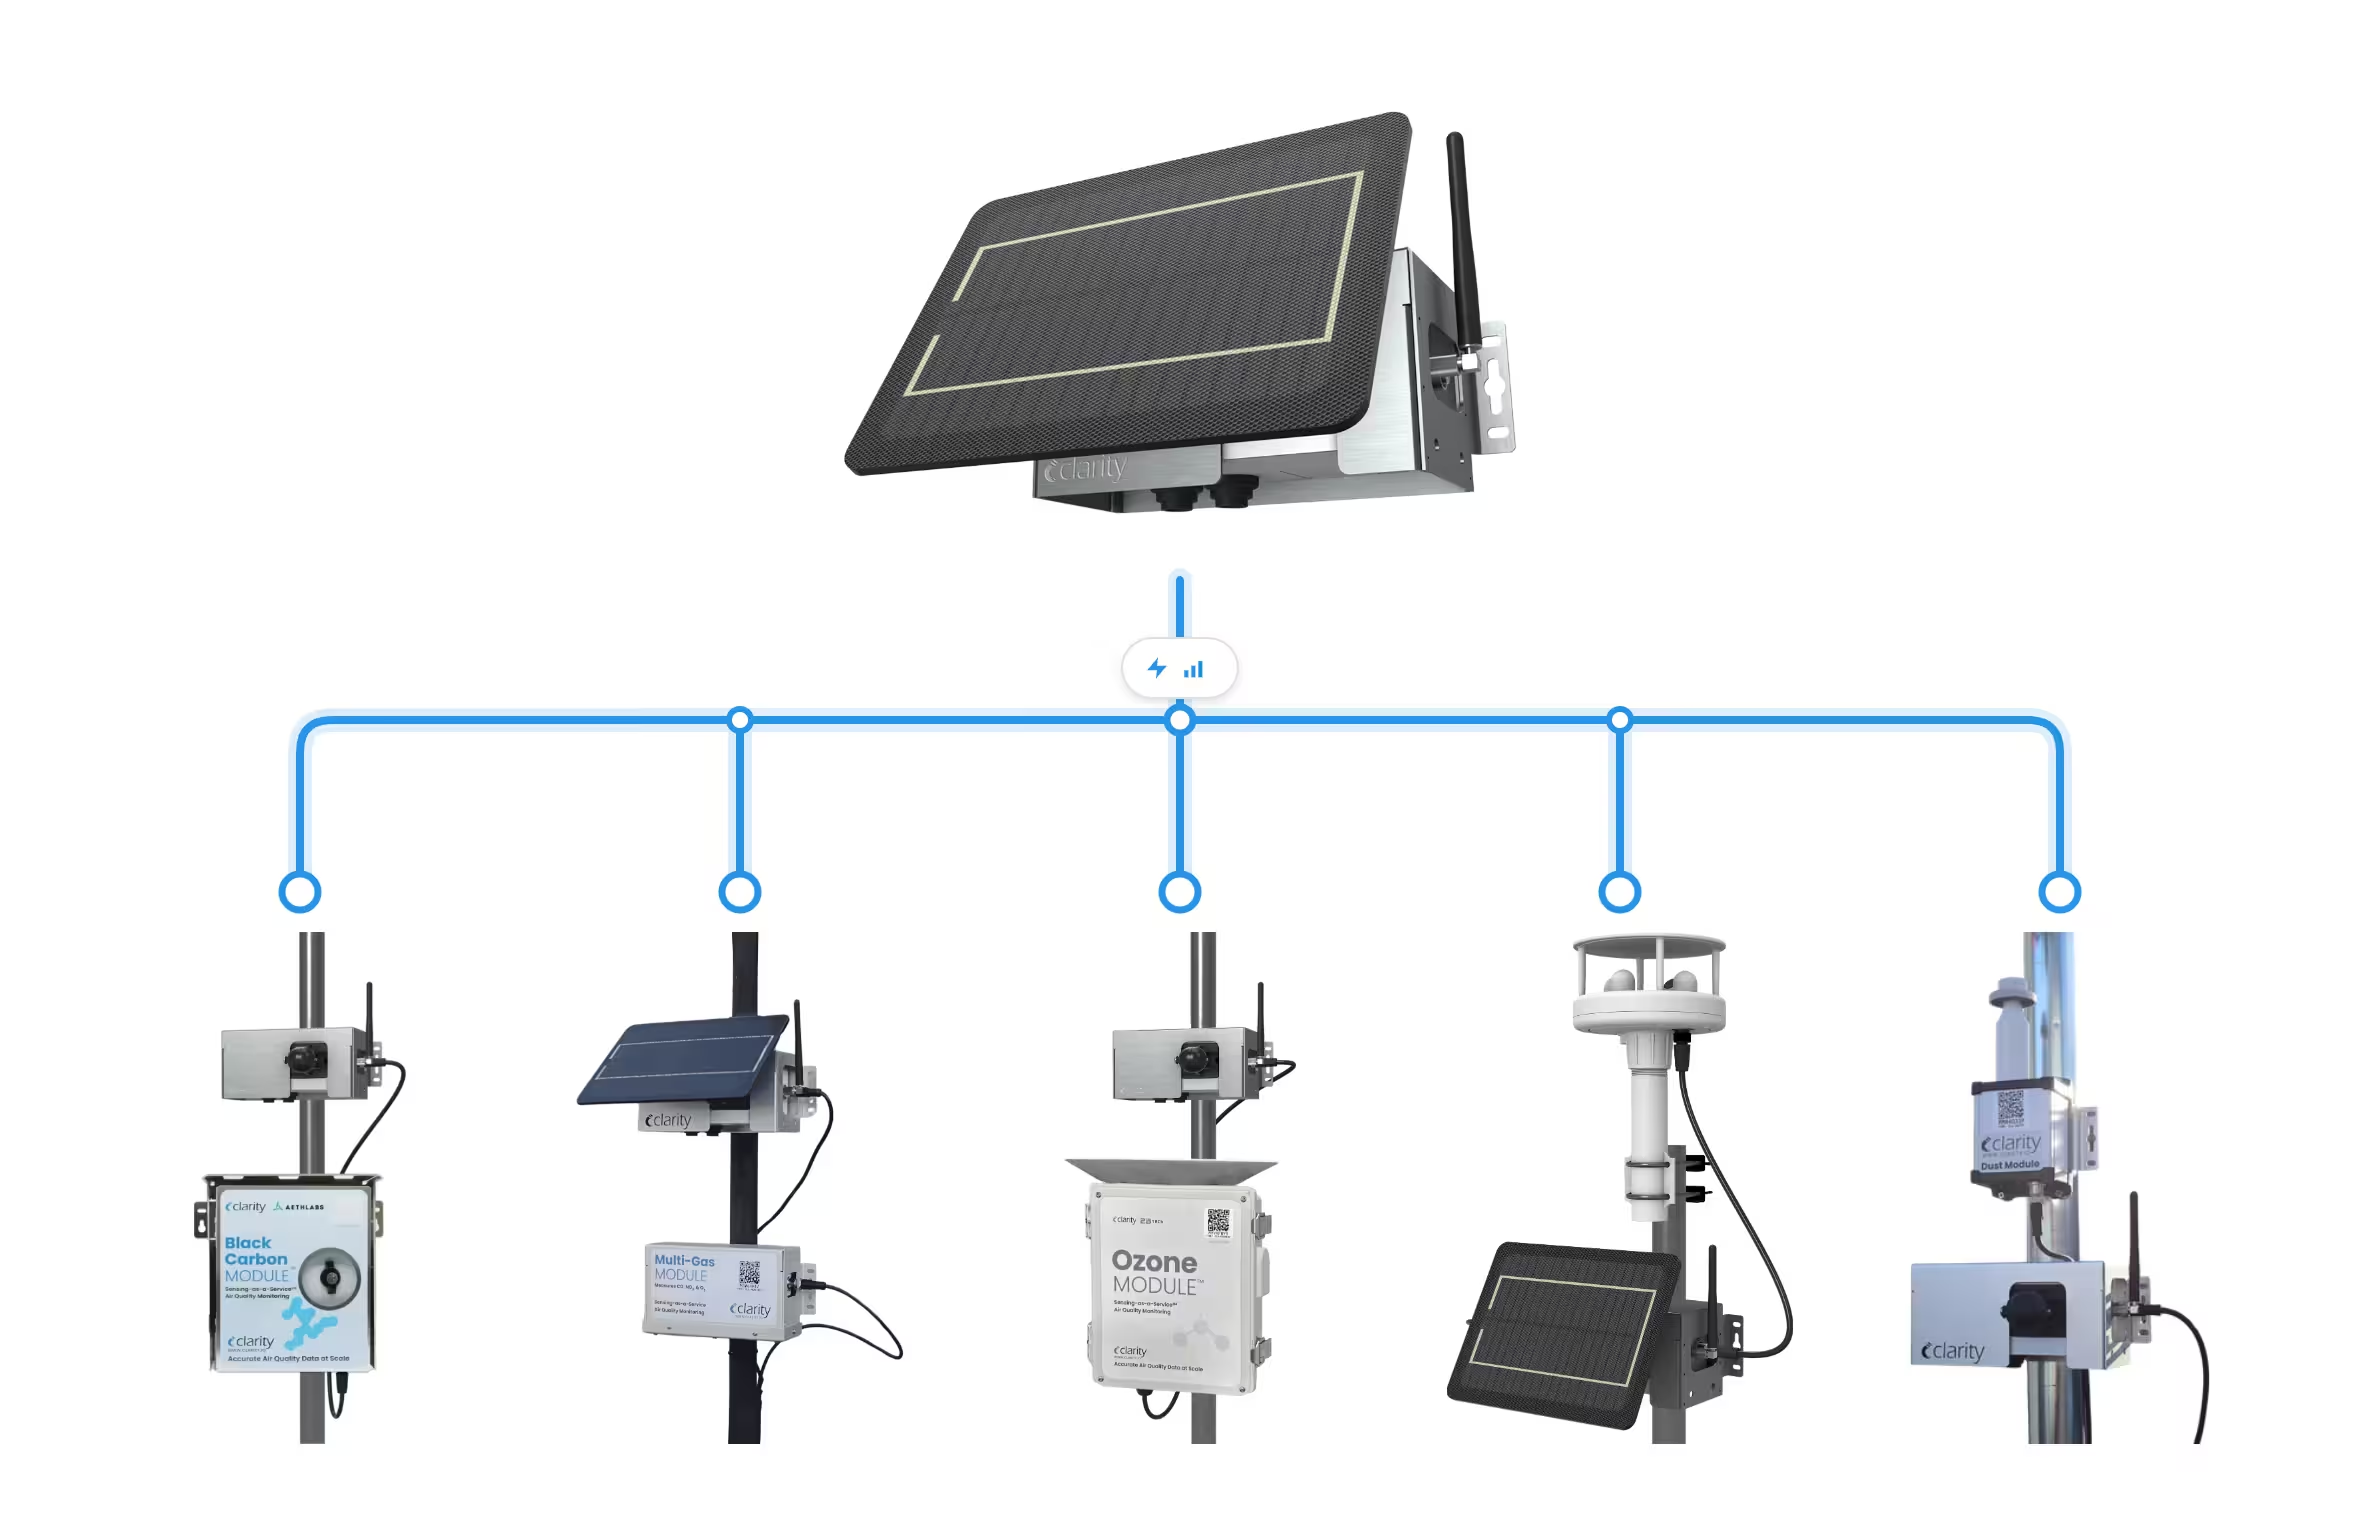
Enhance your air quality monitoring network with Clarity Add-On Modules
Easily add new capabilities to your Node-S network with Clarity Add-On Modules. Designed to integrate seamlessly with Clarity technology, Add-On Modules expand your network’s capabilities, allowing you to measure additional pollutants and environmental factors with ease.
Modules can be attached to existing Node-S air quality sensors in seconds, making it simple to upgrade your air quality monitoring network to measure additional air pollutants over time.
Add-On Modules are based on industry-leading technology and undergo a rigorous selection process. Once selected, Modules are engineered to integrate seamlessly with the Node-S air quality sensor platform and undergo rigorous testing before becoming commercially available.
Here’s a quick look at our available modules
.avif)
.avif)
.avif)
.avif)
.avif)
Interested in upgrading your network?
Contact us today to learn more about how our Add-On Modules can help you meet your air quality monitoring goals.

Harness the full potential of the Clarity Dashboard
Easily manage your devices and visualize air quality data with Clarity’s user-friendly Dashboard.
The Clarity Dashboard is your all-in-one solution for managing your air quality sensor network and visualizing air quality data in real-time. With its intuitive, cloud-based platform, the Clarity Dashboard makes your air quality data accessible, actionable, and easy to understand.
Clarity Dashboard Features
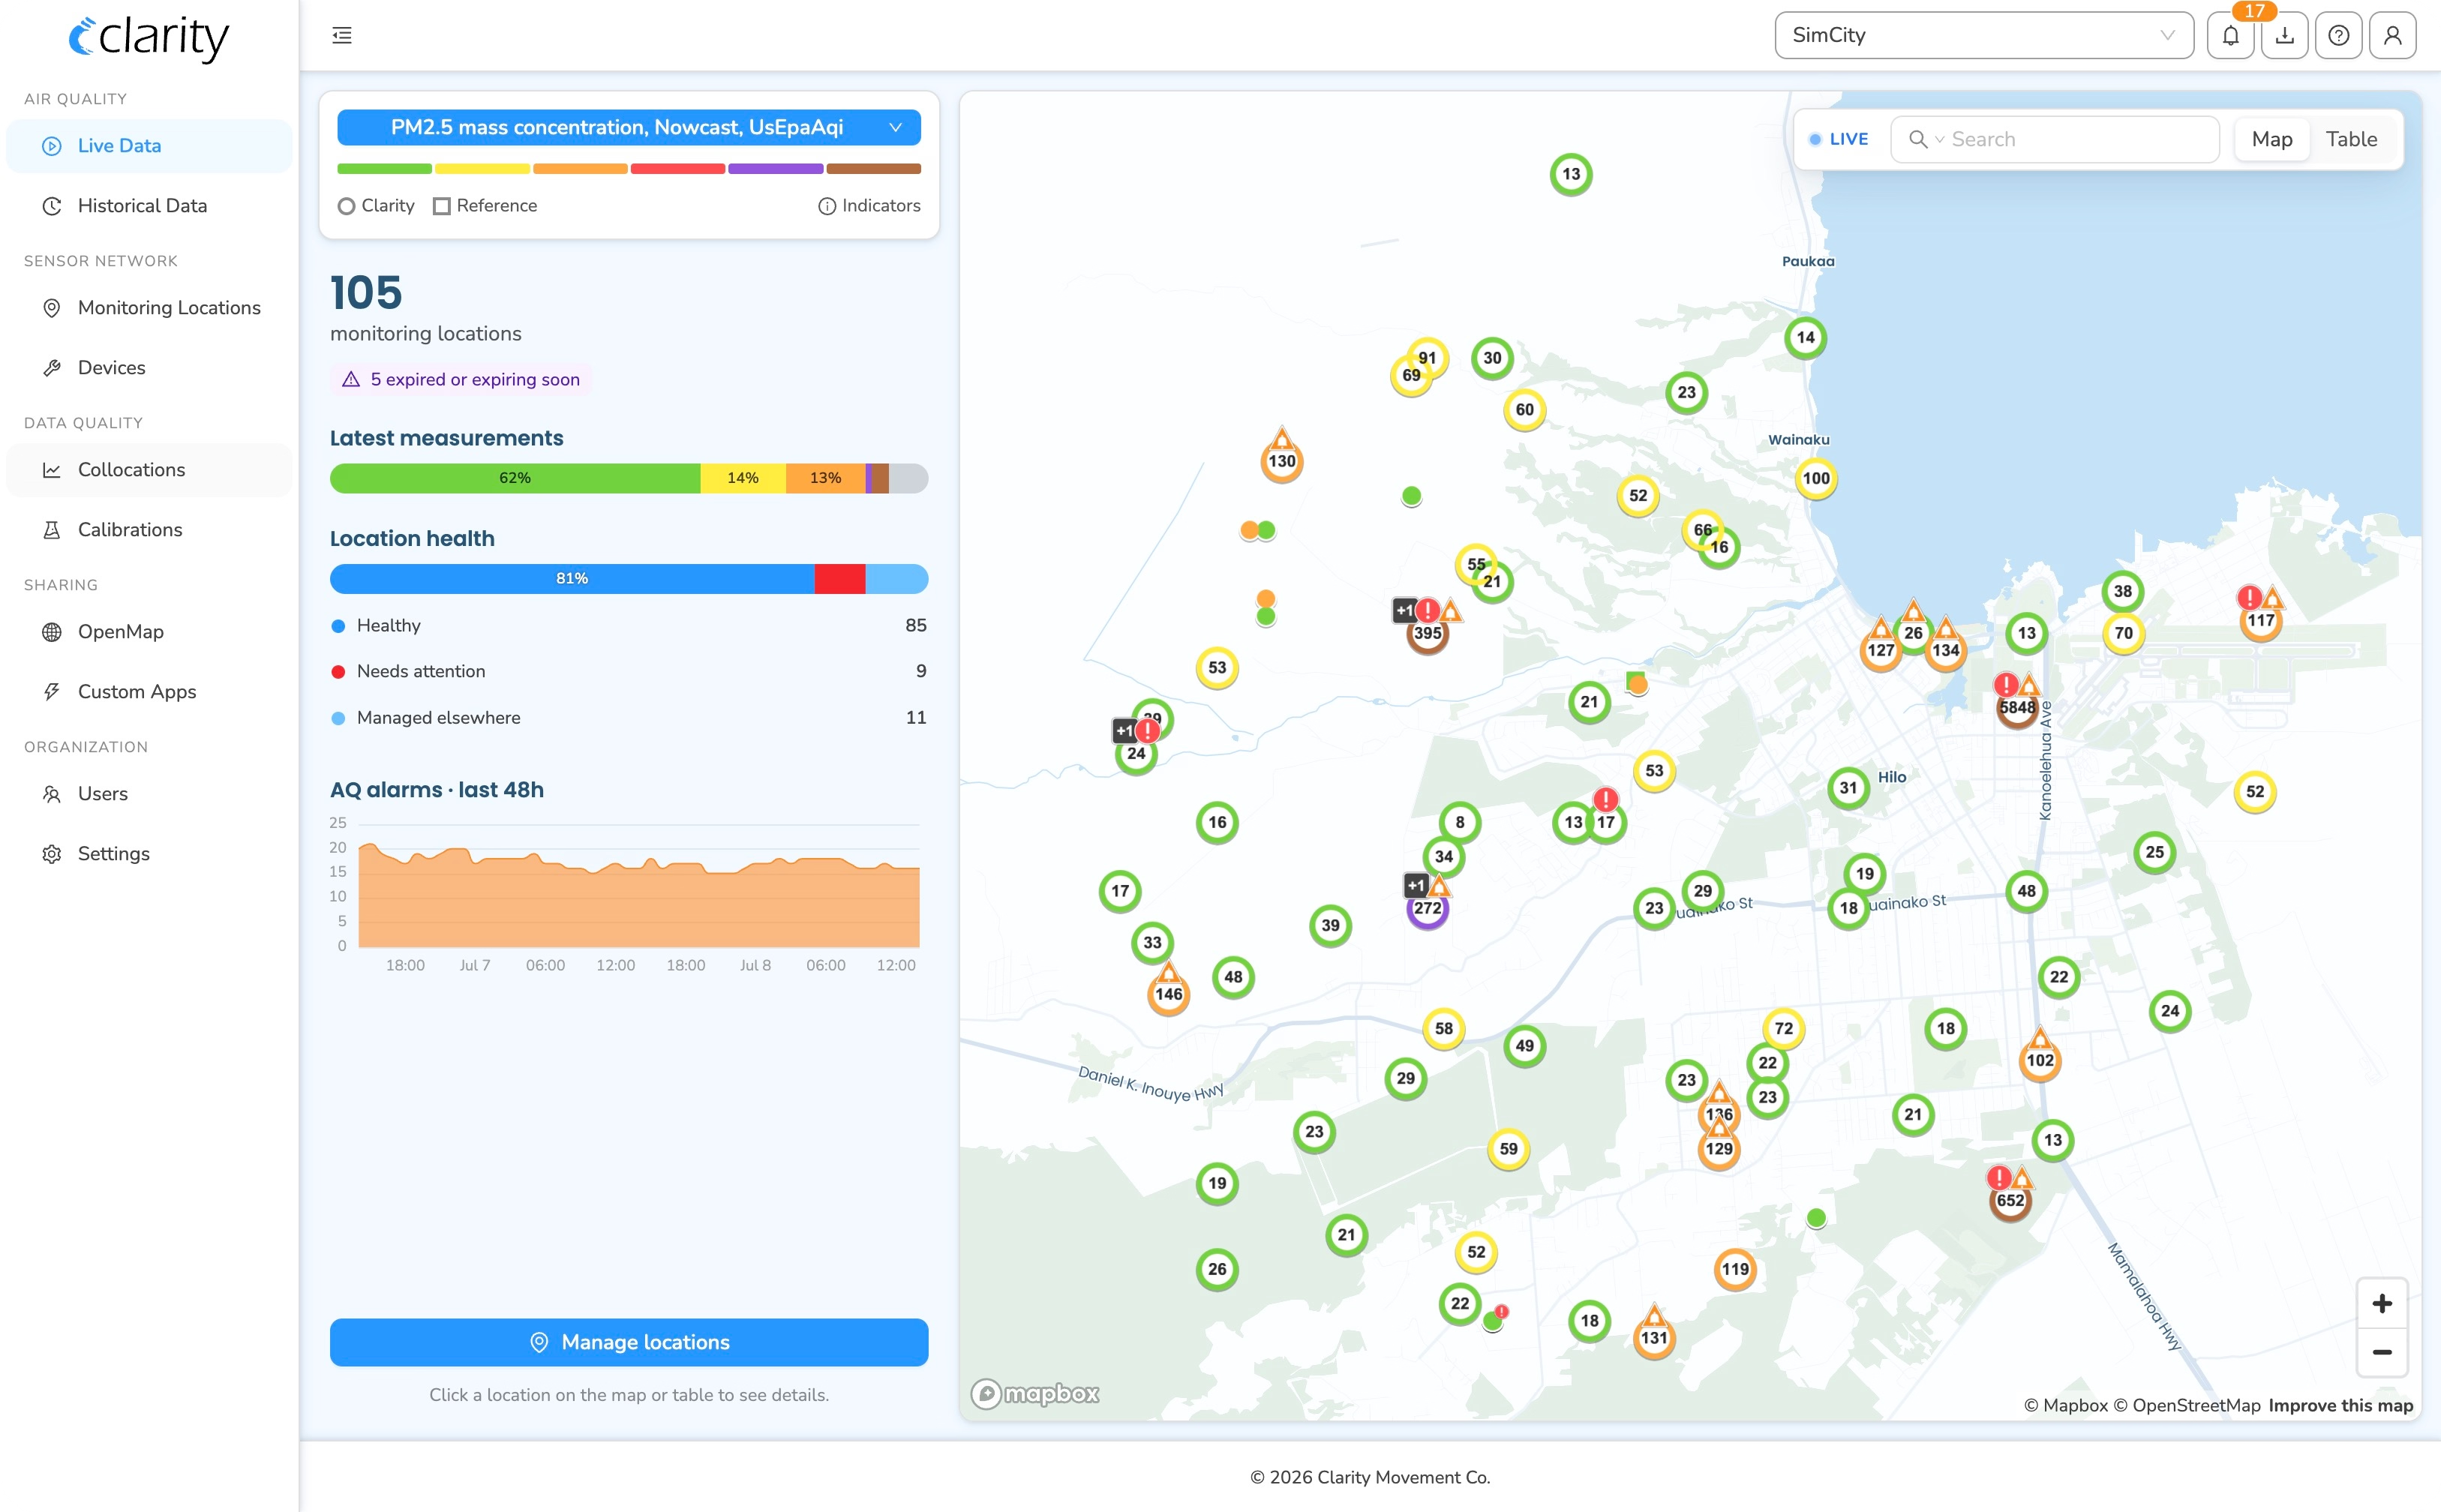
Visualize and Download Live and Historical Air Quality Data
Instantly access raw and calibrated air quality measurements from any time range with interactive maps and a comprehensive suite of advanced charts.
.avif)
Manage Your Sensor Network Effortlessly
Oversee your devices’ health and status, identifying offline or unresponsive sensors and troubleshooting with our comprehensive guides.

Custom Alarms & Notifications
Stay informed about your devices' health and measurements. Receive alerts when a device goes offline, becomes unresponsive, or encounters sensor issues. Define custom thresholds and rules to trigger notifications when specific air pollution measurements or combinations of measurements exceed predefined air quality limits.

Accuracy Reporting for Collocated Devices
Understand how your air quality sensors are performing with a dedicated collocation reporting view provides valuable metrics like R2, MAE, time series, scatter plots, and more.
How the Clarity Dashboard Works
Once your Node-S devices are up and running, your air quality data is immediately transmitted via 3G/4G LTE to the Clarity Cloud, where it’s securely stored, processed, quality controlled, and visualized in the Dashboard in real-time.
After securely signing in, you can seamlessly configure your Node-S devices and Modules, and explore your air quality data using no-code visualization widgets and tools, while also having the option to:
Integrate via API
Enhance functionality by connecting to your existing systems through Clarity’s API.
Share Data Publicly
Make your air quality data publicly accessible through Clarity OpenMap and the Opendata API.


Share your air quality data publicly with Clarity OpenMap
Collecting accurate air quality data is only half the job. Clarity OpenMap is how you get that data in front of the people it affects, turning your sensor network into a public resource your community can use every day with no additional cost and no development work on your side.
OpenMap is a public, interactive map that displays real-time PM2.5 and NO2 Air Quality Index (AQI) values from Clarity's calibrated Node-S air quality sensors alongside government reference monitors. Anyone can access it from any web browser, with no login, no downloads, and no cost to your community.
Sharing is always opt-in. You retain full ownership of your air quality data whether or not you publish it, and a single checkbox that you control via the Clarity Dashboard controls whether your measurements appear publicly.
Clarity OpenMap Features

Your Data on the Global Map
Publish your monitoring locations to Clarity's public air quality map, where residents, researchers, and agencies can view current conditions and long-term trends .

Embed on your Website
Use iFrame embedding to display a live map on your own public site, so your stakeholders get current air quality information without leaving your page.
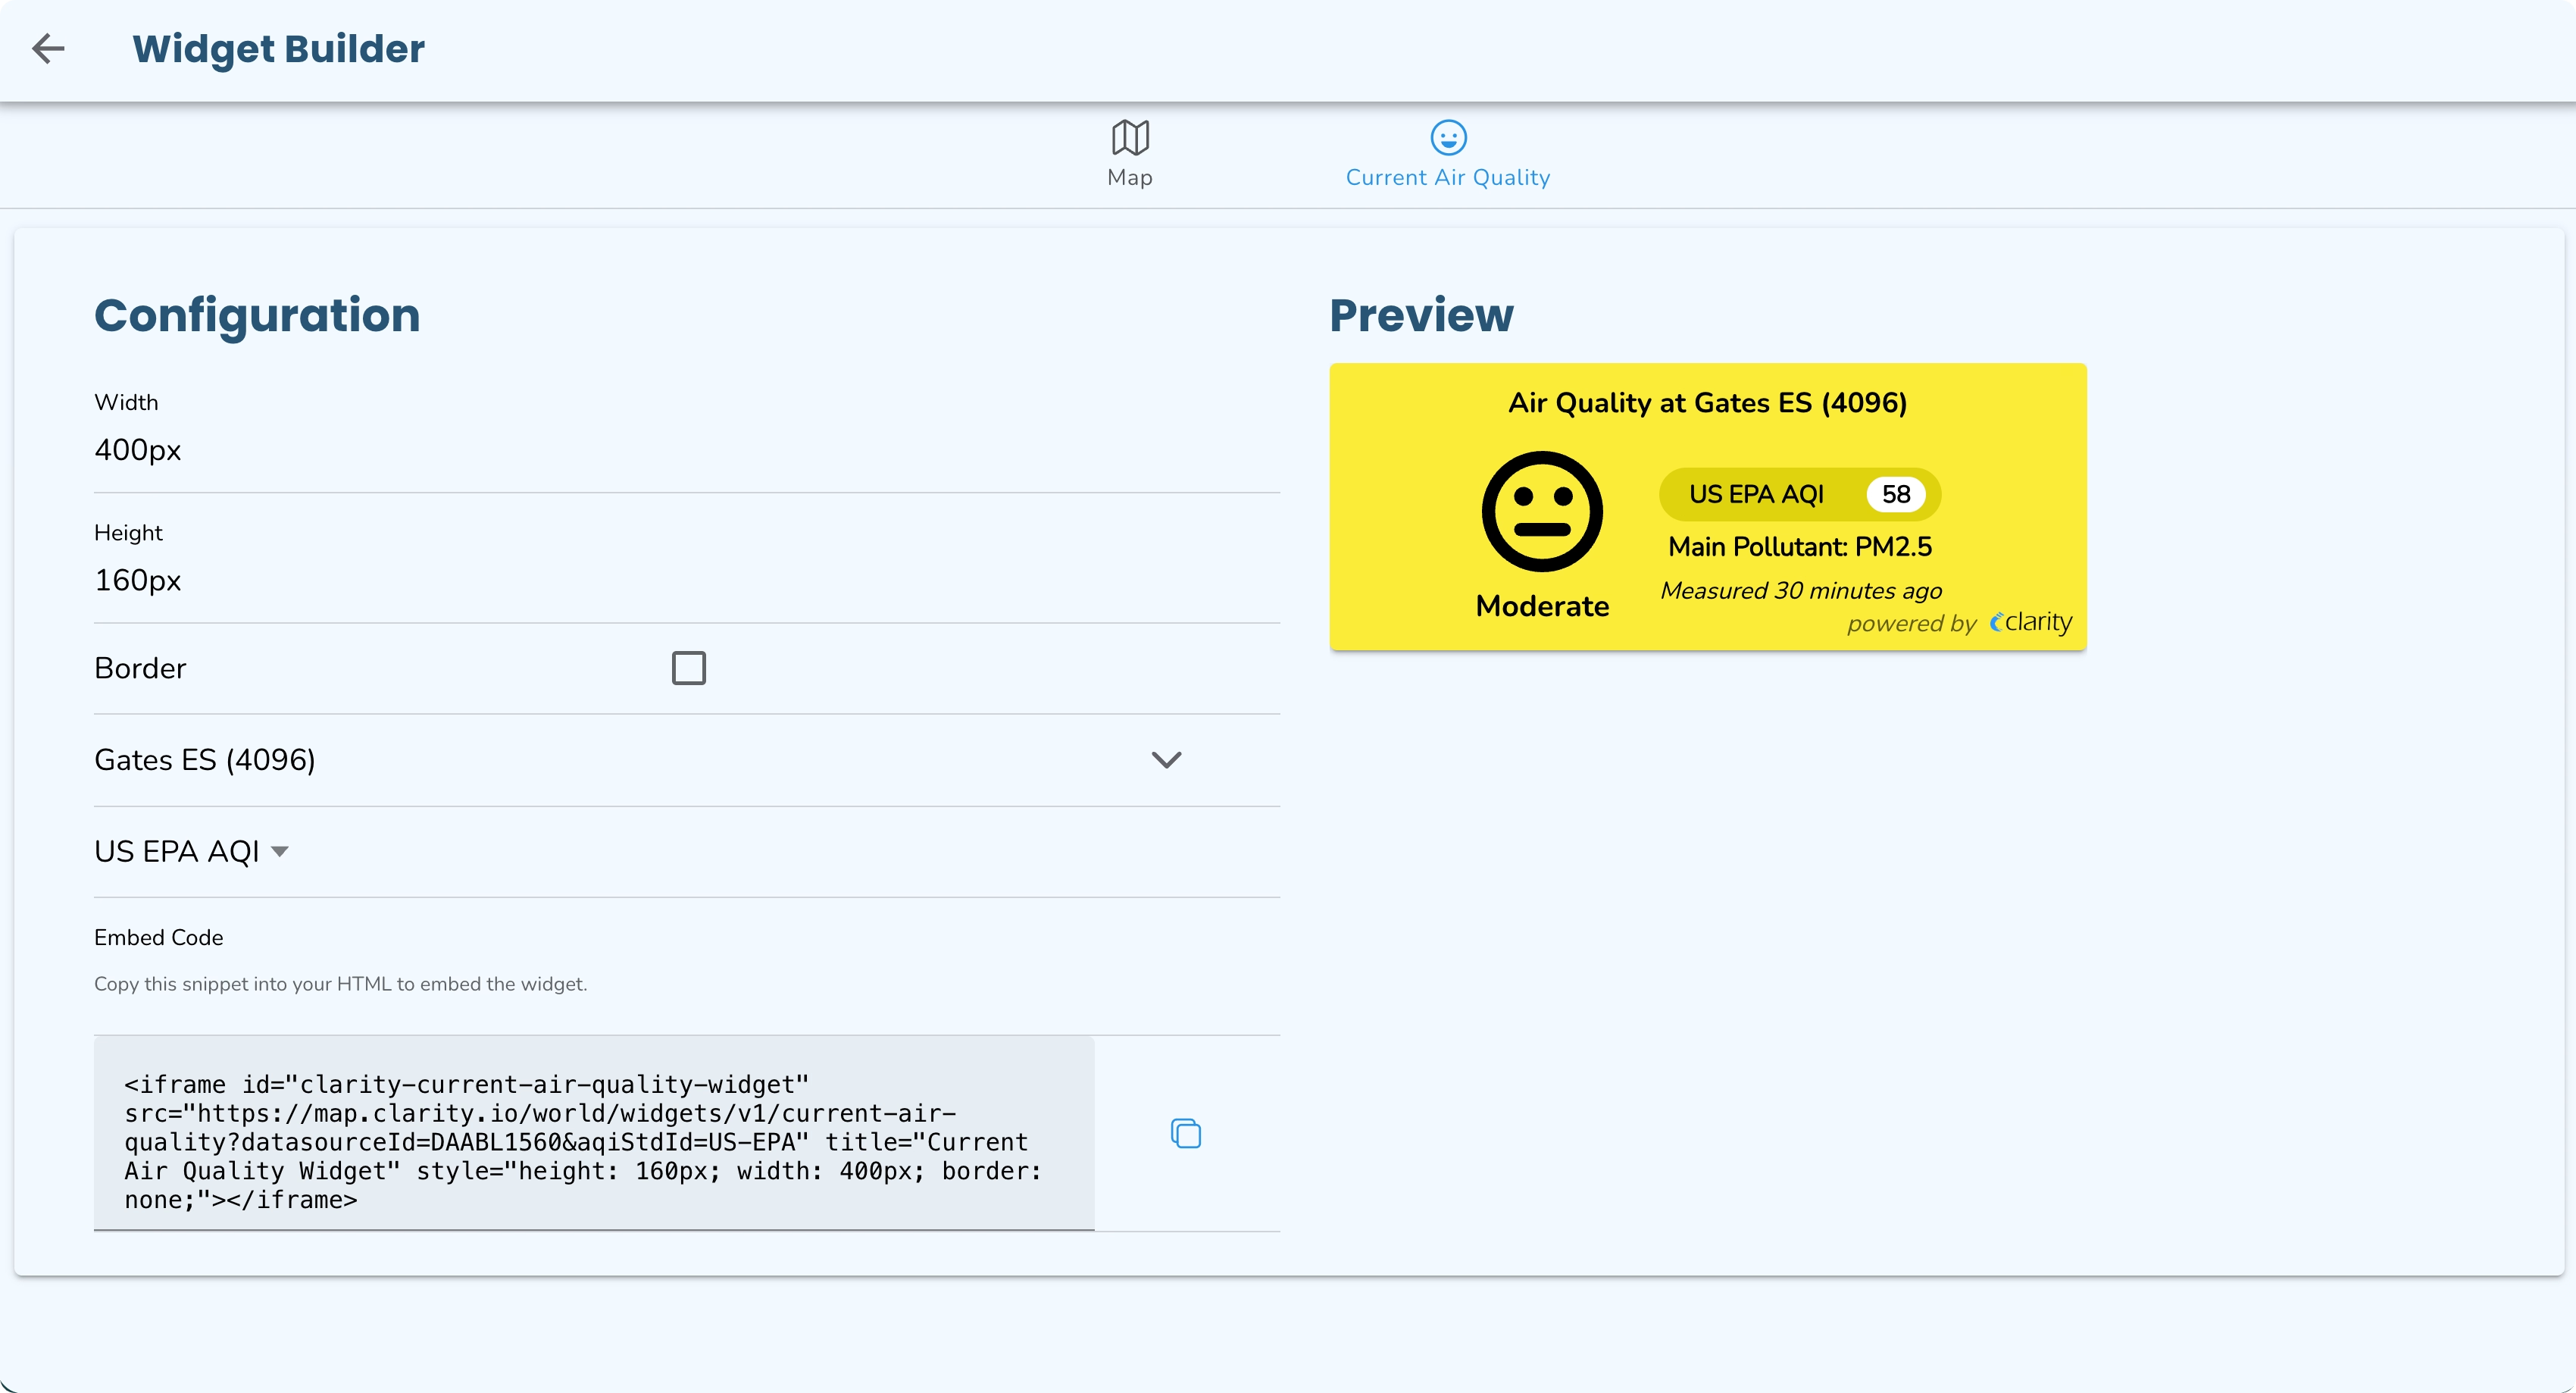
Custom Data Widgets
Build dynamic air quality widgets with live readings from specific monitoring locations and drop them anywhere on your site. Share live air quality conditions to social media in a few clicks.
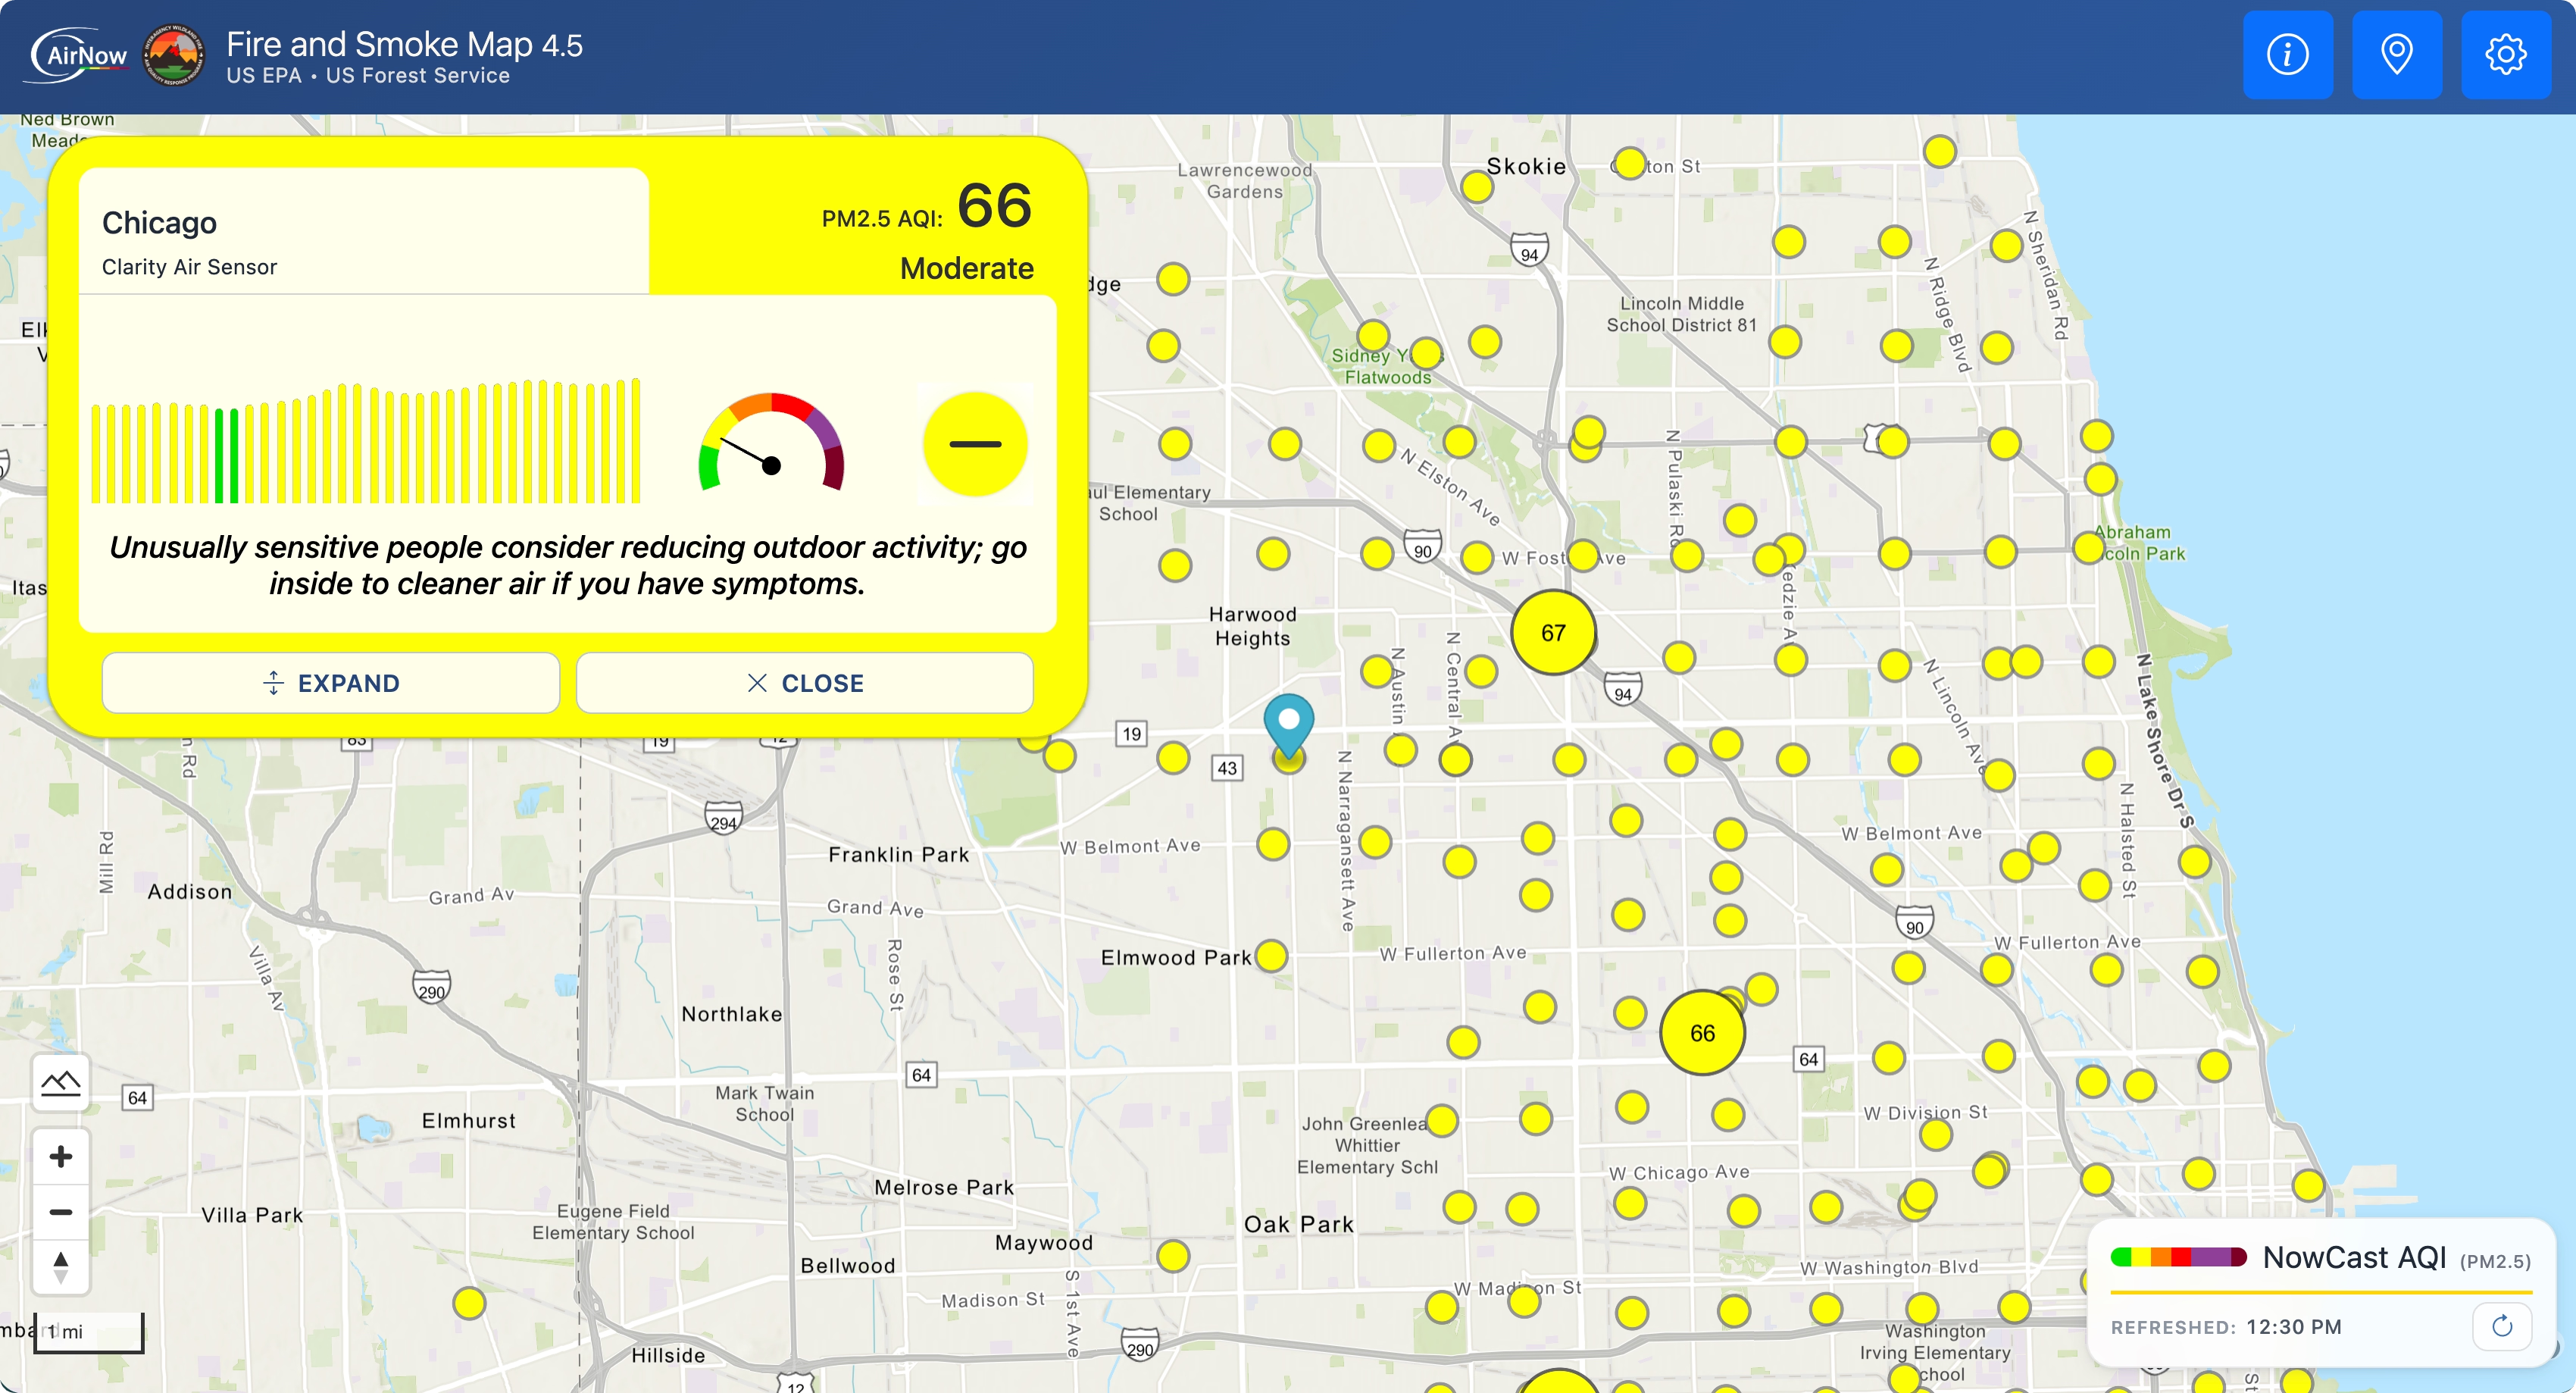
Transparent Open Data Partnerships
Publish to open data partners like OpenAQ and the U.S. EPA alongside OpenMap. Every location on the map is labeled with its data source, calibration status, and associated health recommendations.
Go further with OpenMap Plus
OpenMap is free for every Sensing-as-a-Service customer. If you want a public map that carries your organization's identity rather than ours, OpenMap Plus adds:
Custom Branding
Add your organization's logo and colors so the map reads as your program, not a third-party tool.
A Map Bounded to Your Network
Add your organization's logo and colors so the map reads as your program, not a third-party tool.
Configurable AQI and Health Guidance
Choose which country's AQI standard to display and modify the health recommendations attached to each level.
Email Alerts for Your Community:
Let residents opt in to notifications when air quality in their area reaches unhealthy levels.
Engineering Support
Engineering support: Work with our team on web integrations and advanced setup.
Data Download Widget
Give students, scientists, and community researchers direct access to the underlying measurements.
There is never any cost to community members to access data on OpenMap or OpenMap Plus.
.avif)

Discover the power of automated quality control in the Clarity Cloud
Learn how automated quality control in the Clarity Cloud keeps your air quality data accurate around the clock.
While Clarity’s Node-S delivers highly reliable air quality data for PM and NO₂, even the best equipment can encounter data anomalies. Environmental conditions and occasional sensor limitations may affect measurements, making it crucial to screen for potential issues.
That’s where automated quality control (QC) comes in — learn more about automated QC on our blog and the Clarity Knowledge Base.
Automated QC: Identify and Filter Anomalies
Our new automated QC system on the Clarity Dashboard helps you ensure your data’s integrity. You can easily view flagged and uncalibrated data on the Dashboard and decide whether to investigate further.
QC Flags
Automatically applied to measurements with potential issues, letting you know when data may not be trustworthy.
Calibration Status
Confirms whether your data has been calibrated, so you know it’s accurate for analysis and public sharing.

Simplify Data Management with the Data Cleanup Toggle
Use the Data Cleanup Toggle to quickly filter out flagged or uncalibrated data:

Toggle Off
All measurements are displayed, but flagged data is marked for easy identification.

Toggle On
Filter out untrustworthy measurements, showing only valid, calibrated data in your visualizations.
Automated quality control ensures you’re working with the most reliable data for decision-making and public reporting. Learn more about automated QC on our blog and the Clarity Knowledge Base.

How Clarity handles air quality data calibration
Discover how Clarity’s calibration methods ensure precise and reliable air quality data for your project — see our Clarity calibration explainer.
Even when your air quality measurements come from trustworthy equipment, calibration is essential for the fidelity of your air quality data. Clarity uses cutting-edge calibration methods tailored to your specific environment to deliver the most accurate and reliable data possible.
Here’s how we ensure your data meets the highest standards:
Global Calibration
Every Clarity Node is pre-calibrated using our standard Global Calibration for PM2.5 and NO2, enhancing accuracy without the need for a reference monitor.
Custom Collocation-Based Calibration
For even greater precision, our Custom Collocation-Based Calibration allows you to fine-tune your air quality data based on your specific location, pollution conditions, and climate. This method involves collocating your devices near a reference monitor for at least 4 weeks, providing project-specific performance evaluation, and is included free of charge as part of Sensing-as-a-Service.
Raw Data Transparency
You always have access to both raw sensor measurements and calibrated data through our API and Clarity Dashboard. While raw data can be useful for internal analysis, we recommend using only calibrated data for any public or decision-making purposes.
Our calibration processes ensure your air quality data is scientifically validated, defensible, and traceable back to the raw sensor measurements. Whether you choose the standard Global Calibration or opt for a custom collocation-based approach, we’ve got you covered.

How does Clarity air quality data perform around the world?
See how Clarity sensors perform under real-world conditions to provide data you can trust.
At Clarity, we’re dedicated to providing you with air quality data that’s both accurate and reliable, even in the most challenging environments. That’s why we’re committed to transparency and scientific integrity in how we evaluate and report the performance of our sensors.
While you can always check our collocation results library for regional performance profiles, we believe it’s important to provide a comprehensive view of how our Node-S sensors perform in the real world, across various climates, pollution levels, and conditions.
We’re not content with cherry-picking our best results. Clarity has deployed thousands of Node-S devices in more than 80 countries around the world, providing us with a rich and diverse dataset to evaluate their performance.
Our Performance Quantification Dataset — drawn from over 450 collocated Nodes in 45+ cities across the globe—offers insight into how the Clarity Node-S operates in a wide range of settings.
Clarity Global Performance Quantification Dataset
450+
Collocated Clarity Nodes
2,000+
Collocation Months
45+
Collocation Cities
6,000,000+
Collocated Measurements
To assess the performance of our sensors, we rely on two key metrics:
R²: Measures the ability of the sensor to capture fluctuations in pollution levels.
RMSE: Evaluates the accuracy of those measurements compared to reference monitors.
The boxplots shown here display the distribution of two performance metrics, R2 and RMSE, for each device in the Clarity Performance Quantification Dataset. These metrics are calculated using the raw data, standard Global Calibration, and Custom Collocation-Based Calibration.

Understand how Clarity devices perform around the world
Check out our Calibration Explainer to see how our Node-S sensors perform across climates and pollutant concentrations, or head to Clarity’s library of collocation results where you will find performance evaluations from different regions and environmental conditions.

Maximize the impact of your air quality monitoring with Clarity Add-On Services
Unlock actionable insights and expert support with Clarity’s tailored Add-On Services.
Looking to turn your air quality data into action? Clarity’s Add-On Services are designed to help you maximize the impact of your air quality program — ensuring that you not only collect accurate air quality data but also use it to drive meaningful action.
With experience deploying air quality networks in over 70 countries, we’re familiar with the challenges of establishing an air quality monitoring program. Whether you need deployment support, expert data analysis, or strategic planning, our team of specialists is here to provide custom solutions to overcome any challenges you face.
Available Add-On Services

Additional Clarity Environmental Project Manager time
Maximize the success of your air quality projects with individualized guidance from a dedicated Environmental Project Manager. Beyond the standard support, our experts will provide tailored assistance, insight, and oversight throughout your program. Benefit from a personal point of contact who understands your unique needs and challenges.

Remote or On-site Deployment Support
Ensure smooth and efficient deployments with Clarity’s Remote or On-site Deployment Support. Our team will guide your field technicians through the proper installation and configuration of air quality measurement devices, ensuring they are operational and ready to collect data immediately. This service helps prevent common deployment issues, saving you time and resources.

Network Design Workshops
Strategic placement of your air quality measurement equipment is crucial for meaningful data collection and analysis. Our workshops provide expert guidance on site selection, taking into account factors such as local topography, pollution sources, and logistical considerations. This ensures your network is optimally designed for reliable and effective air pollution monitoring.

Air Quality Trainings
Equip your team with the knowledge and skills needed to effectively manage air quality measurement equipment and interpret air pollution data. Our Air Quality and Air Sensors 101 trainings cover the basics of air quality monitoring, sensor technology, data interpretation, and best practices. No previous air quality experience is required, making it an ideal starting point for new team members.

Air Quality Program Design
Develop comprehensive air quality programs that are tailored to your specific region and goals. Through facilitated workshops and training sessions, Clarity helps you build collaborative air quality initiatives. We provide strategic guidance on stakeholder engagement, governance structure, funding acquisition, and more, ensuring your program is set up for long-term success.

Data Analysis
Gain deeper insights into your air quality data with Clarity’s bespoke Data Analysis services. Our scientists use advanced analytics to investigate air pollution sources, model exposure reductions from interventions, and answer your specific research questions. These insights are critical for making informed decisions and demonstrating the impact of your air quality initiatives.
Interested in Add-On Services?
If you're interested in Clarity Add-On Services, contact us to learn how we can help you achieve your air quality goals.