
Image provided courtesy of Brightline Defense.
Wildfire smoke monitoring
Air Quality Monitoring for Wildfire Smoke
Deploy resilient smoke monitoring that keeps working when power and WiFi fail. Clarity's solar-powered, cellular PM2.5 sensors deliver real-time, hyperlocal data, so agencies and communities can issue timely alerts and protect public health.
Wildfire smoke monitoring equipment trusted by:



.png)


The only professional-grade air monitoring solution on the EPA’s Fire & Smoke Map
As wildfires grow in frequency and intensity, Clarity’s Node-S air pollution sensor is the only professional-grade air quality sensor trusted by the EPA’s Fire & Smoke Map to help agencies, cities, and schools protect public health during wildfire events. When facing wildfire smoke, Clarity’s air quality monitoring solutions help you provide faster response, better data for decision-makers, and peace of mind for communities.
Don’t rely on consumer gadgets to protect your community during wildfire events. Get the proven, EPA-validated solution for wildfire smoke monitoring. The Clarity Node-S is purpose-built to tackle wildfire smoke, unlike other low-cost sensors that often lose accuracy in heavy smoke and harsh conditions.
Whether you’re a tribal air quality program looking to fill coverage gaps, a school district safeguarding students, or a county air agency augmenting your network, Clarity has done it before – and we’re ready to help you do it next.
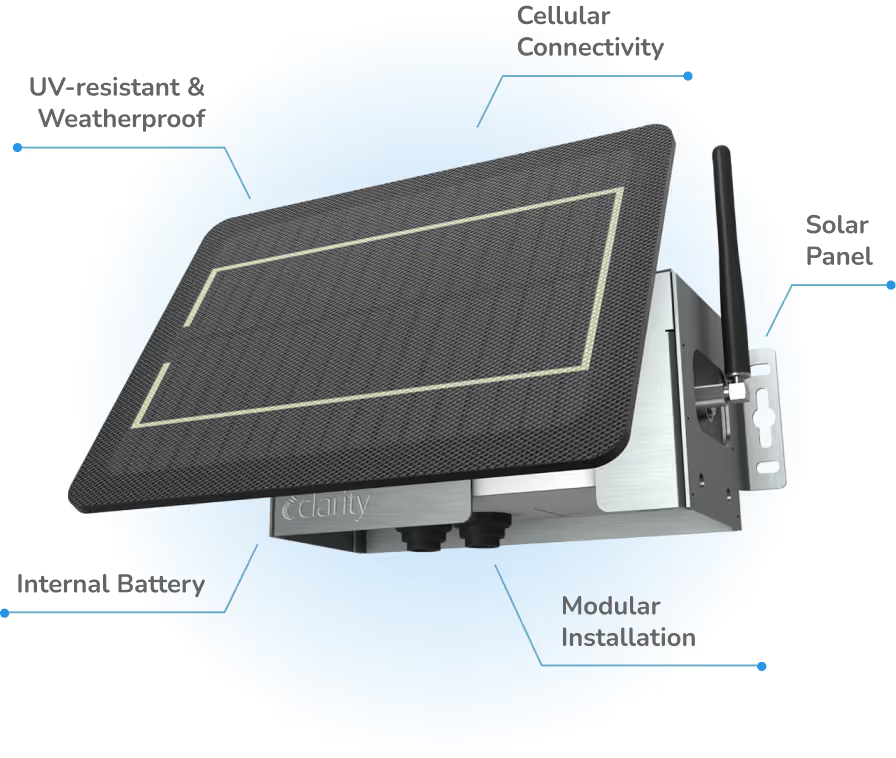
Clarity vs. other sensors on the Fire & Smoke Map
| Other Sensors | ||
| Affordable Monitoring | Affordable annual subscription | Cheap hardware purchase |
| Pollutants Measured | PM2.5, PM10, NO2, NOx, CO, O3, Black Carbon, Wind & Meteorological available | PM2.5 only |
| Cellular Connectivity | Integrated global cellular (3G/4G) | WiFi required |
| Solar Powered Design | Integrated solar, deploy anywhere | Line power required |
| Data Ownership | Customer owns all data produced by Clarity Nodes | Vendor owns (and sells) all data produced |
| Data Accessibility | Clarity Dashboard, REST API, and OpenMap | Data access through map & REST API |
| Data Calibration | Calibrated data for accurate, consistent measurements | Raw data that may require calibration for accuracy |
| Project Support | Expert project support and managed service | Not provided, user-supported community forums |
| Network Scalability | Adaptable and designed for deployment at scale | Limited by need for power and WiFi |
| Minimal Maintenance | Minimal maintenance, remotely monitor device status on Dashboard | Frequent onsite maintenance required |
| Hardware Warranty | Free device replacement under warranty throughout subscription | Limited 1-year warranty |
Los Angeles Unified’s Air Monitoring Network During the 2025 Los Angeles Wildfires
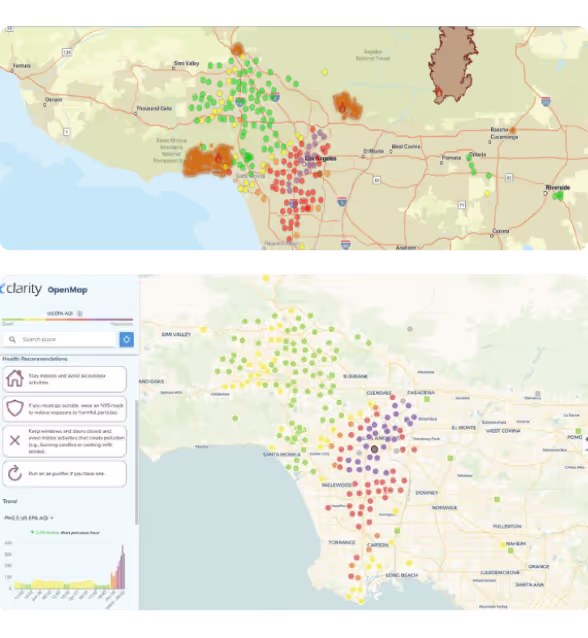
With smoke-related air pollution spreading rapidly and unpredictably during the devastating Los Angeles wildfires of January 2025, the Los Angeles Unified Air District turned to its network of 200+ Node-S air quality sensors in its Know Your Air Network for real-time, local data on air pollution levels. This allowed LAUSD leadership to keep students safe from the severe health impacts associated with wildfire smoke, which are particularly harmful for vulnerable populations like children.
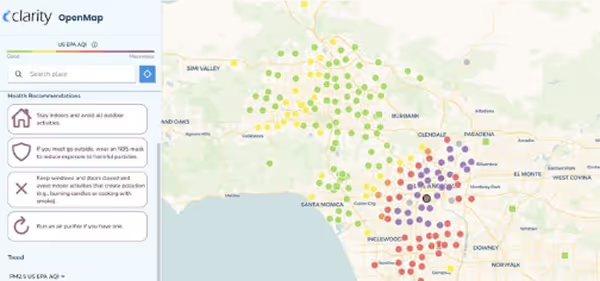
In addition to sharing data on the EPA’s Fire & Smoke Map, Clarity’s OpenMap provided another useful tool for visualizing the spread of air pollution at locations across the district.
Trusted by government agencies and non-profits to
protect communities against wildfire smoke


“I’m now able to see where each one of my monitors is. The color of the dot tells me what air quality it’s currently recording. I can then click on any one of those individual monitors to get more information.”

"Clarity’s staff have been super supportive and helpful. Anytime anything goes wrong, or I have a question about how part of the Dashboard works or anything about the sensors, Clarity’s team is on it.”
"We did assess other monitoring solutions. Ultimately, reliability, durability, pricing, and connectivity even in remote areas were our primary reasons for selecting the Clarity Node-S. The solar panel option made siting far more convenient, and we have never had battery issues."

"The Clarity air monitoring network has directly informed my decision to put out public smoke advisories in four prior instances when wildfire smoke was bad. There's a difference between knowing that smoke is in the area, and knowing how bad it is and if it merits notifying the whole community. That's sovereignty — knowing what needs addressed with our own sensor network and being able to act on that info with our own powers."


"We don’t have a lot of staff time to spend setting up or fine-tuning this equipment — Clarity’s managed service model allows us to multiply the number of Node-S sensors in our network with minimal additional overhead on our end. We're going from six particulate matter monitors to more than 20 — with one placed in each local municipality — so we expect to have more granularity in looking at how smoke impacts people across our three-county jurisdiction."


"The Node-S is solar powered, has impressive battery life, and transmits data via cellular network. That means we could put these monitors anywhere that the sun shines and you can make a cell call. After the Marshall fire we installed a total of 22 monitors in the burn area. "


"Clarity was our first-choice air quality monitoring provider for several reasons. We enjoyed working with the Clarity team - they are highly knowledgeable and always responsive. The Node-S devices themselves are also incredibly resilient, which was especially important for us when deploying the monitors in emergency conditions during the wildfire events this past year."

"Clarity works very nicely for our wildfire air monitoring network. Their Node-S sensors are very quick to install and very easy to use, thanks to the native solar panel and cellular antenna. Not having to use somebody else's WiFI in a remote location is great — that had been a major issue for us with several projects.”

Deploy air monitoring rapidly with the Wildfire Smoke & Emergency Response Air Monitoring Kit!
The Wildfire Smoke and Emergency Response Air Monitoring Kit is a comprehensive solution designed to provide vital air quality information during emergency air pollution events. This all-in-one kit includes everything you need for wildfire smoke monitoring and effective disaster response.
The kit consists of four Clarity Node-S air quality sensors, specifically calibrated to detect PM2.5 particles, which are known to be prevalent in wildfire smoke.
Wildfire smoke air quality monitoring equipment
See more information on Clarity’s wildfire air quality monitoring solutions. These bundles combine our core Node-S air quality monitor with wildfire-specific Add-on Modules and software tools – everything you need to track smoke and protect your community.
Dust (PM10) Module
Highly accurate coarse particulate detection for dust and ash
Bigger particles like ash become major pollutants during and after wildfires. The Dust Module plugs into the Node-S to measure coarse particulate matter (PM₁₀) and total suspended particulates (TSP) in real time to provide reliable, high-resolution data on large particle pollution that standard smoke sensors can miss. With this module, you can effectively track and manage dust and ash impacts – even in remote, off-grid environments – thanks to seamless solar-powered, cellular Node-S integration. Available now for pilot testing!
Use Case: A county air quality agency equips Node-S monitors with the Dust Module around a wildfire burn scar during cleanup efforts. This helps them detect harmful ash and dust particles being stirred up, allowing timely health advisories and protective measures for workers and returning residents.
Get a quote!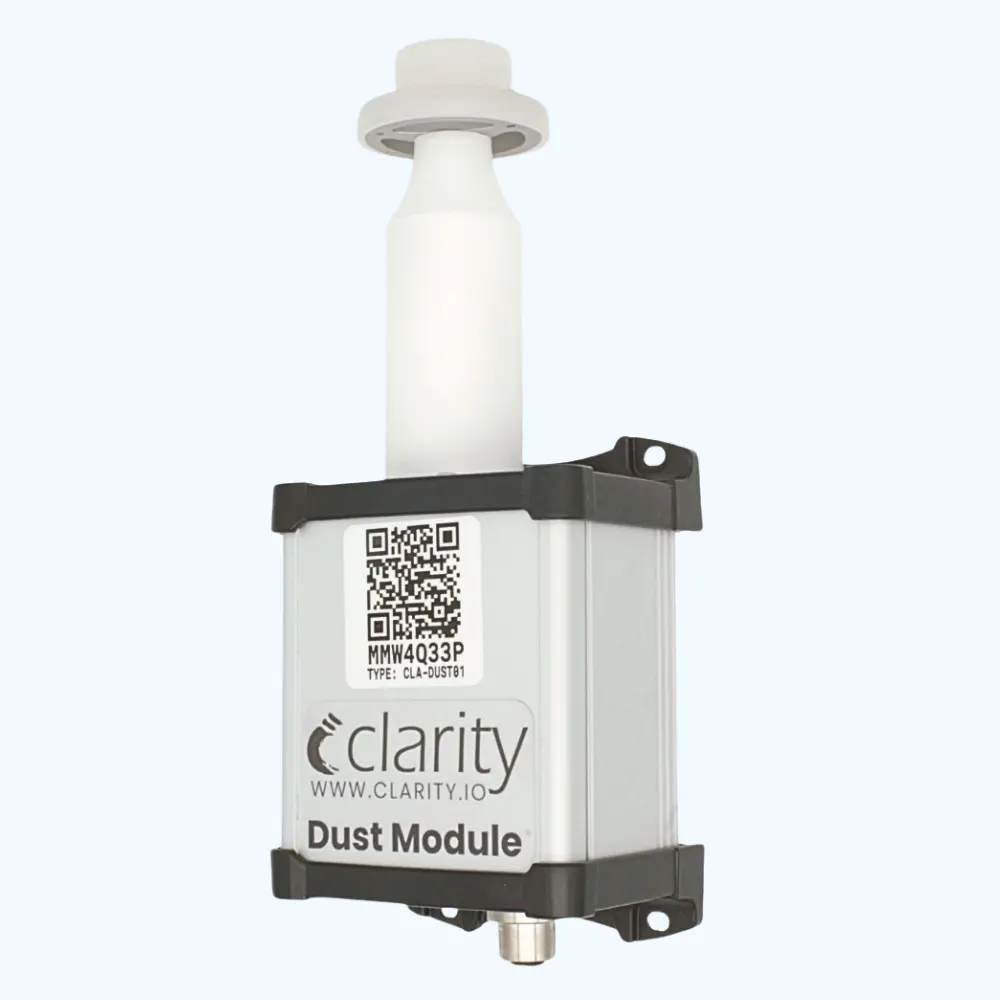
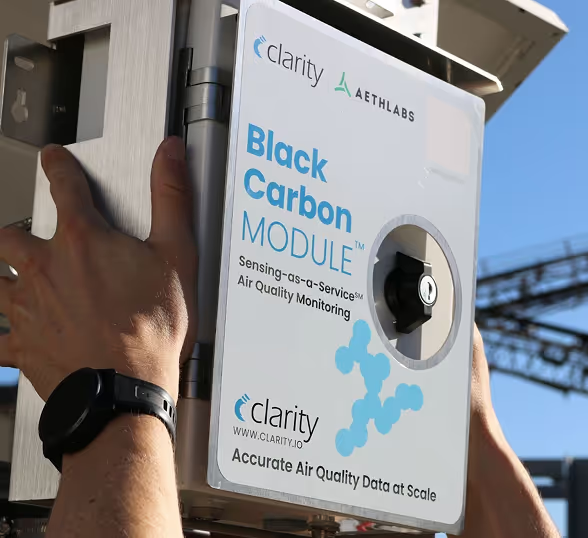
Black Carbon Module
Distinguish wildfire smoke from other urban air pollution sources
Wildfire smoke isn’t just PM2.5 – it has a unique signature. Our Black Carbon Module identifies the sooty black carbon within particulate matter, using 5-wavelength optical analysis. This helps you tell apart biomass smoke vs. other pollution sources. For example, if haze is coming from a wildfire, black carbon levels will spike differently than if the haze were from local traffic.
Use Case: A regional air district can deploy the Black Carbon Module to confirm that elevated PM is due to wildfire smoke (rich in black carbon) and not an industrial source, informing appropriate health advisories.
Get a quote!Multi-Gas Module
Measure carbon monoxide & ozone to evaluate smoke chemistry
Wildfires don’t only create particles; they also emit gases that impact health. The Multi-Gas Module adds sensors for CO and O₃ (carbon monoxide and ozone) – two key pollutants during fires. CO is a direct tracer of wildfire smoke; high CO readings mean a fresh smoke plume is present (indicating danger even if particles are not visible). Ozone can surge on sunny days downwind of wildfires due to chemical reactions in the smoke. By monitoring both, you get a more complete picture of air quality.
Use Case: A school district can use the Multi-Gas add-on to know if outdoor CO is creeping up from nearby wildfires (a sign to keep an eye on indoor air quality), and if outdoor ozone is reaching levels that trigger asthma warnings
Get a quote!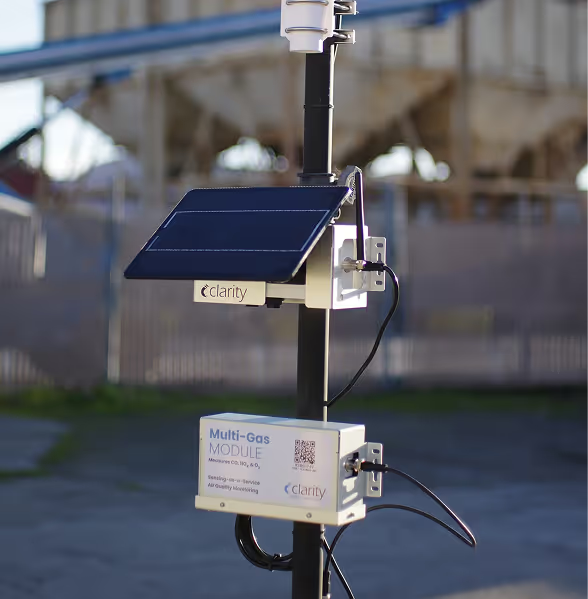
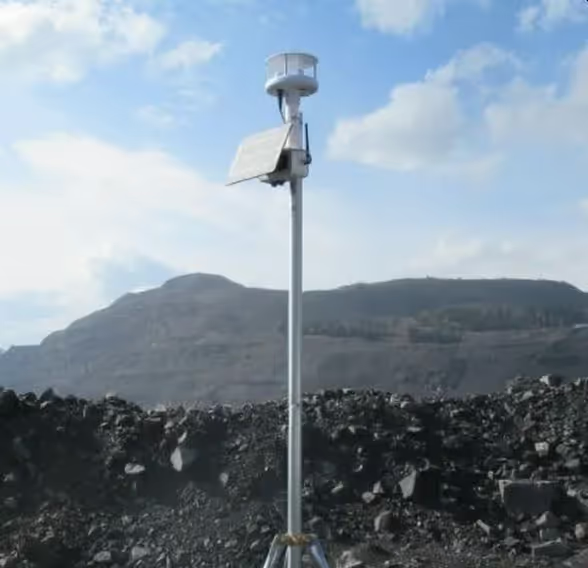
Wind & Met Module
Track wind speed & direction to better predict spread and improve forecasts
Understanding where smoke is coming from and where it’s heading is crucial in wildfire events. The Wind & Meteorological Module plugs into the Node-S to measure local wind speed and direction, plus environmental conditions. This lets you correlate pollution spikes with wind shifts – essentially pinpointing the source and trajectory of smoke.
Use Case: A tribal air program might deploy Wind Modules with their sensors around a reservation. When a wildfire ignites nearby, they can see that “smoke levels are rising at the east sensor when winds blow from the east” – confirming the fire’s impact and helping predict which communities will be hit next.
Get a quote!OpenMap Plus
Build a custom-branded, public-facing wildfire air quality map
During wildfire season, transparency and public information are vital. OpenMap Plus is our cloud software feature that lets you instantly publish your air pollution sensor readings to a public map or website with custom branding. In an emergency, you can share an easy link with residents so they see real-time air quality in their neighborhood (without needing to interpret complex data). OpenMap Plus also provides simple tools for community engagement – embed the map on your site, add briefing notes, and notify your constituents in real time with email alert subscriptions.
Use Case: A regional air district creates a public OpenMap page showing all its Clarity sensors, so during a wildfire, residents can zoom into their town and see current smoke levels and health messages. This builds trust and helps people make decisions (evacuate, stay indoors, etc.) based on live local data.
Get a quote!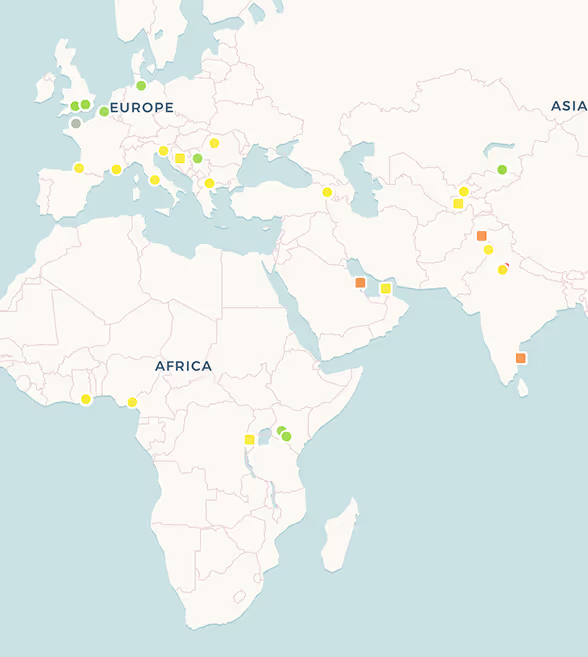
Why Clarity for wildfire air pollution monitoring?
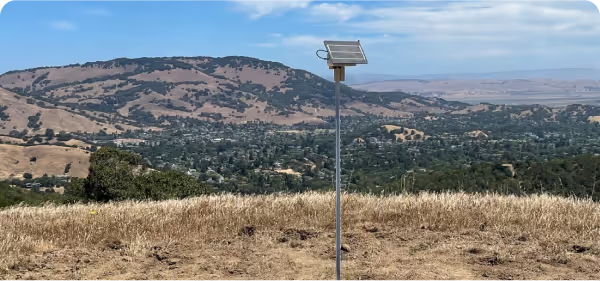
Rugged & Low Maintenance for Remote Deployment
Built for professional use outdoors, Clarity air quality sensors are weatherproof, durable, and require virtually no maintenance or manual calibration. Deploy them anywhere in minutes, without headaches — no downtime, just continuous data. Unlike hobby sensors that need frequent maintenance, our Node-S monitors are solar-powered and cellular-connected, so they keep reporting through smoke, heat, and dust during wildfire emergencies when power or WiFi infrastructure may fail.
EPA-Validated Accuracy for Wildfire Smoke
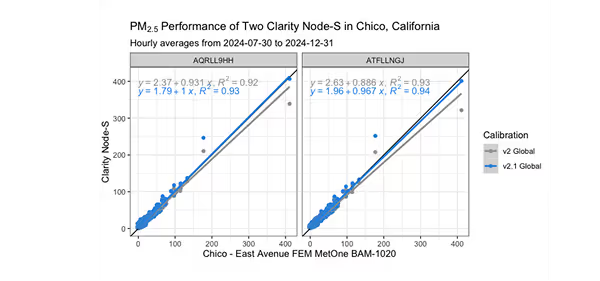
Clarity’s sensors use advanced calibration and QC to maintain accuracy even in extreme smoke conditions. While consumer sensors can overestimate pollution or vary device-to-device during wildfires, Clarity Nodes are expertly calibrated and field-validated by the EPA to meet performance targets during wildfire smoke events. We developed a specialized wildfire calibration model for the EPA FASM to ensure readings stay reliable even at very high AQI levels. With Clarity, you get actionable data you can trust when air quality reaches hazardous levels.

Modular Platform for Multi-Pollutant Insight
Clarity’s modular air monitoring platform goes beyond basic particle counts. The Node-S measures PM2.5 and NO2 and can be expanded with the Black Carbon, Ozone, Multi-Gas, and Wind Add-on Modules (see bundles below) to fully characterize wildfire smoke. Modules integrate seamlessly with the Node-S, giving you the flexibility to adapt your air monitoring network to changing air pollution conditions and get the complete picture of smoke impacts that consumer sensors can’t match.
Real-Time Air Pollution Data & Alerts
All Clarity data feeds into our cloud Dashboard in real time, with the option to share data publicly using a custom iteration of our OpenMap data sharing platform with your organization’s branding (free for a limited time!). WIth our our AQ Alarms and OpenMap email notification features, you can alert your community instantly when conditions worsen. No more waiting for hourly data from reference monitors — Clarity delivers up-to-the-moment data to inform decisions (school closures, public alerts, etc.).
Featured on EPA’s Fire & Smoke Map
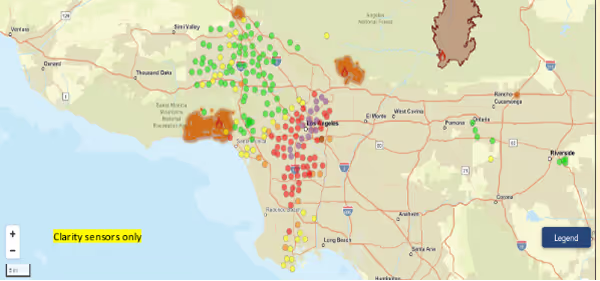
In January 2025, as devastating wildfires struck Los Angeles, over 200 Clarity sensors across the LA metro were rapidly integrated into the EPA’s official Fire & Smoke Map. The EPA team fast-tracked Clarity’s inclusion because our data passed preliminary accuracy tests and dramatically improved coverage in smoke-impacted areas. Clarity is the only professional-grade air pollution sensor included on the Fire & Smoke Map. This EPA validation ensures that Clarity’s data meets rigorous standards during wildfire events.

Proven in Real-World Wildfire Response
Clarity has been battle-tested in major wildfire incidents, from Boulder, Colorado, to San Francisco, California. During the January 2025 Southern California wildfires, LAUSD’s Clarity network provided critical real-time PM2.5 readings and AQI updates as smoke choked the region. Emergency responders and the public relied on Clarity’s sensors to guide school closures, health warnings, and evacuation decisions — real-world proof of performance under pressure.
Frequently Asked Questions
Wildfire smoke contains high concentrations of PM₂.₅ that can cause serious respiratory and cardiovascular issues. Real-time air quality monitoring is essential to protect public health during wildfire events, enabling timely alerts, evacuations, and clean air interventions. Learn more in our Wildfire Smoke and Air Quality blog.
Yes. Clarity sensors measure PM₂.₅ and other pollutants associated with wildfire smoke. Our wildfire-specific calibration model adjusts readings during smoke-heavy events, improving accuracy even in extreme pollution scenarios.
During fires, air quality can change by the hour. Monitoring allows air quality agencies to issue targeted health warnings, protect vulnerable populations, and assess the effectiveness of response actions. Clarity’s solar-powered, cellular-connected sensors continue operating even when infrastructure fails.
Fixed monitors rely on electricity and internet, which often fail during wildfires. They’re also too sparse to detect hyperlocal variations. Clarity’s low-cost, resilient sensors fill critical gaps, providing reliable data when it’s needed most.
Clarity’s solar-powered Node-S air quality sensors can be rapidly deployed and begin transmitting real-time data via cellular networks immediately. This flexibility enables localized air quality alerts, supports public health messaging, and helps prioritize response efforts. Explore our wildfire response capabilities.
Clarity sensors can be installed and operational within hours. They’re lightweight, plug-and-play, and don’t require external power or Wi-Fi, making them ideal for emergency deployments. Pre-positioned kits allow for rapid response in fire-prone regions.
Yes. Boulder County used 22 Node-S monitors after the Marshall Fire to track PM₂.₅ levels and inform recovery plans. Nonprofits in San Francisco have also used Clarity sensors to protect vulnerable populations during wildfire smoke events.
Standard optical sensors can overestimate PM₂.₅ during dense smoke. To improve accuracy during smoke-heavy conditions, Clarity created a wildfire-season calibration model based on multi-year collocation data. It corrects overestimation tendencies common in optical sensors during intense smoke events.
It’s automatically applied in the Clarity Cloud, requiring no user action. Sensors send raw data to the cloud, where calibration is processed before display—ensuring real-time, accurate results during wildfire events.
Clarity regularly updates its calibration models using collocation data from sensors placed near reference monitors worldwide. This ongoing process ensures models remain accurate for smoke and other pollution events. Read about our v2.1 global calibration for more detail.
Get wildfire-ready air monitoring in place
Tell us what you need to monitor and a Clarity air quality expert will scope a resilient, EPA-validated sensor network for your community and budget, usually within one business day.
✓ Solar-powered and cellular, deploys where power and WiFi fail
✓ The only professional-grade sensor on the EPA Fire & Smoke Map
✓ Rapid emergency deployment available
Request a quote
Prefer to talk?
Talk to an expert →