









The Node-S, an air quality monitor for wildfire smoke, being deployed.

Photo: Lapalmauz, CC BY-SA 4.0 (creativecommons.org/licenses/by-sa/4.0), via Wikimedia Commons. Modified: cropped, Clarity Node-S added. This image is available under the same license.

Data center fenceline monitoring

Air Quality Monitoring for Data Centers

On-site power plants and backup diesel generators at artificial intelligence (AI) data centers release PM2.5, CO, NO₂, and NOₓ at the fenceline, where regional monitoring stations rarely see it. Clarity's solar-powered, cellular sensors provide continuous, local, real-time air pollution data that you own, so you can measure emissions around the site and answer questions about its impact on neighboring communities with confidence.

Why monitor

Purpose-built for data center fenceline monitoring

Every new data center adds banks of backup diesel generators, and every test run, grid-support event, and outage puts particulate matter, nitrogen oxides, and volatile organic compounds (VOCs) into the surrounding air. Continuous fenceline monitoring is a non-negotiable for data centers.

The Clarity Node-S measures PM2.5 and NO₂ natively and expands to NOₓ, CO, O₃, black carbon, PM10, and wind with add-on modules. It can be used to support a range of goals:

  • Air permitting and emissions reporting, with continuous data for 24/7 emissions visibility
  • Equipment protection from corrosive gases and dust drawn into cooling and intake systems
  • Worker and fenceline community health, especially in nonattainment areas and environmental justice communities
  • Environmental impact and climate reporting tied to generator runtime
  • Community trust and ESG reporting backed by public, real-time data
Request a Quote

The six NAAQS criteria pollutants

The National Ambient Air Quality Standards (NAAQS) set limits for six pollutants. Highlighted chips are the ones a Clarity network measures.

PM
Particulate matter (PM2.5, PM10)
Measured
NO₂
Nitrogen dioxide
Measured
CO
Carbon monoxide
MEASURED
O₃
Ozone
MEASURED
SO₂
Sulfur dioxide
Not measured
Pb
Lead
Not measured
Other pollutants also measured for data center attribution:
NOₓNOBlack carbonPM10 (Dust Module)Wind speed and direction

SO₂ and lead are regulated but rarely material for gas or Tier 4 diesel generator sites using ultra-low-sulfur fuel. Read the standards guide for what applies to your permit.

Air quality monitoring trusted by

  1. Partner logo
  2. Partner logo
  3. Partner logo
  4. Partner logo
  5. Partner logo
  6. Partner logo
  7. Partner logo
  8. Partner logo
  9. Partner logo
  10. Partner logo
  11. Partner logo
  12. Partner logo
  13. Partner logo
  14. Partner logo
  15. Partner logo
  16. Partner logo
  17. Partner logo
  18. Partner logo
  19. Partner logo
  20. Partner logo
  21. Partner logo
Compare

Clarity vs. other sensors for data center air pollution monitoring

For permitting, ESG reporting, and community trust, the question is not what a spec sheet says. It is whether the data holds up when a regulator or a neighbor asks.

Clarity Node-SOther low-cost and consumer sensors
Flexible sitingSolar and cellular. Mount on the perimeter fence, a rooftop, or near intakes with no mains power or Wi-Fi.Needs line power and Wi-Fi
Pollutants coveredPM2.5 and NO₂ natively, plus modular NOₓ, CO, O₃, black carbon, PM10, and windPM2.5 only
Data qualityNear-reference-grade accuracy with calibration and collocation, and per-sensor performance metrics you can citeUncalibrated, drifts device to device
Data ownershipYou own all of your data. Private by default, public only when you opt in.Vendor owns, and may sell, your data
Community transparencyPublic, custom-branded OpenMap with embeddable widgetsNo public data layer
Support and serviceDedicated environmental project manager through Sensing-as-a-ServiceCommunity forums
Warranty and upkeepFree replacement under subscription, remote device health monitoring, no scheduled maintenanceOne-year warranty and frequent site visits
Clarity Node-S fenceline air quality monitor with Wind Module at the Kansanshi copper mine, a First Quantum Minerals site in Zambia
Customer story: First Quantum Minerals
Real-world example

Fenceline monitoring in action

Kansanshi Mine fenceline network

6
Node-S sensors with Wind Modules
Real time
Replacing single-day tactical samples
Fewer
Site visits and maintenance costs

Data center fenceline programs are new, so we point to the closest analog: heavy industry monitoring perimeter emissions next to a community. Kansanshi Mining PLC, a First Quantum Minerals subsidiary, runs one of Africa's largest copper mines in Zambia's dusty Solwezi District.

Before Clarity, the team relied on tactical samplers that produced one 24-hour reading at a time, so a month of monitoring was represented by a handful of days. Clarity designed a six-sensor Node-S network with Wind Modules at the key perimeter locations, calibrated it, and monitors device health remotely. Management now sees spikes the day they happen and can trace them to a source, third-party auditors and authorities have praised the data, and fewer site visits have cut maintenance costs.

"The feedback from management to the new Clarity network has been amazing. Now they're able to identify a day with a higher reading and say, 'What was happening on this date?' and we can follow up immediately."Elisha Mulilo, Air Quality & Emissions Specialist, Kansanshi Mine
Read the full customer story →

Trusted by operators at the fenceline

Dr. Amy L. Stuart

Professor and Chair, Department of Global, Environmental, and Genomic Health Sciences, College of Public Health, University of South Florida

“This air monitoring network has been a great collaborative project across government entities and the university. People recognize the importance of engaging communities in environmental data gathering and providing real-time data for both communities and government agencies. People are saying, yeah, this is important. We need to have more of these.”

Read Customer Story

Sally Newsom

Member, Clean Air 4 Schools

“Affordable, accessible tech like the Clarity Node-S is a total game changer. It’s giving power to the people and I love that, it’s really exciting.”

Read Customer Story

Dr. Kofi Amegah

Project Lead and Professor at University of Cape Coast

“The impact has been enormous, and it will continue to be so. We can’t discount the fact that the Clarity Node-S sensors have been instrumental to the impact that we are achieving. The sensors are very reliable, and the measurements are continuous.”

Read Customer Story

Cody Cook-Winscher

Air Quality Specialist at the Quinault Indian Nation Environmental Protection Department

"Clarity’s staff have been super supportive and helpful. Anytime anything goes wrong, or I have a question about how part of the Dashboard works or anything about the sensors, Clarity’s team is on it.”

Read Customer Story

Cody Cook-Winscher

Air Quality Specialist at the Quinault Indian Nation Environmental Protection Department

"We did assess other monitoring solutions. Ultimately, reliability, durability, pricing, and connectivity even in remote areas were our primary reasons for selecting the Clarity Node-S. The solar panel option made siting far more convenient, and we have never had battery issues."

Read Customer Story

Cody Cook-Winscher

Air Quality Specialist at the Quinault Indian Nation Environmental Protection Department

"The Clarity air monitoring network has directly informed my decision to put out public smoke advisories in four prior instances when wildfire smoke was bad. There's a difference between knowing that smoke is in the area, and knowing how bad it is and if it merits notifying the whole community. That's sovereignty — knowing what needs addressed with our own sensor network and being able to act on that info with our own powers."

Read Customer Story
Talk to an air quality expert
Equipment

Data center air monitoring equipment and add-on modules

Start with the Node-S air quality sensor, then add the modules that map to your permit and to the pollutants neighbors ask about.

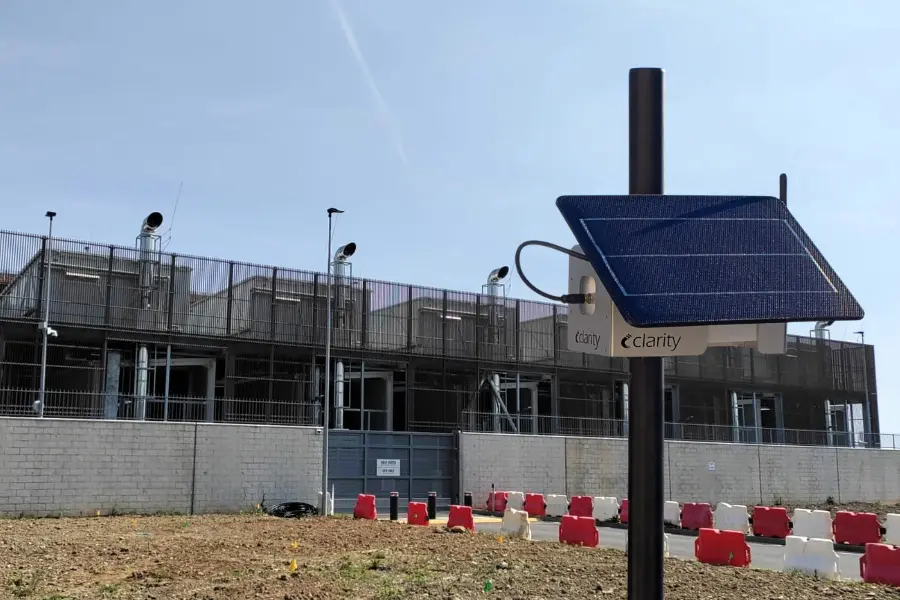
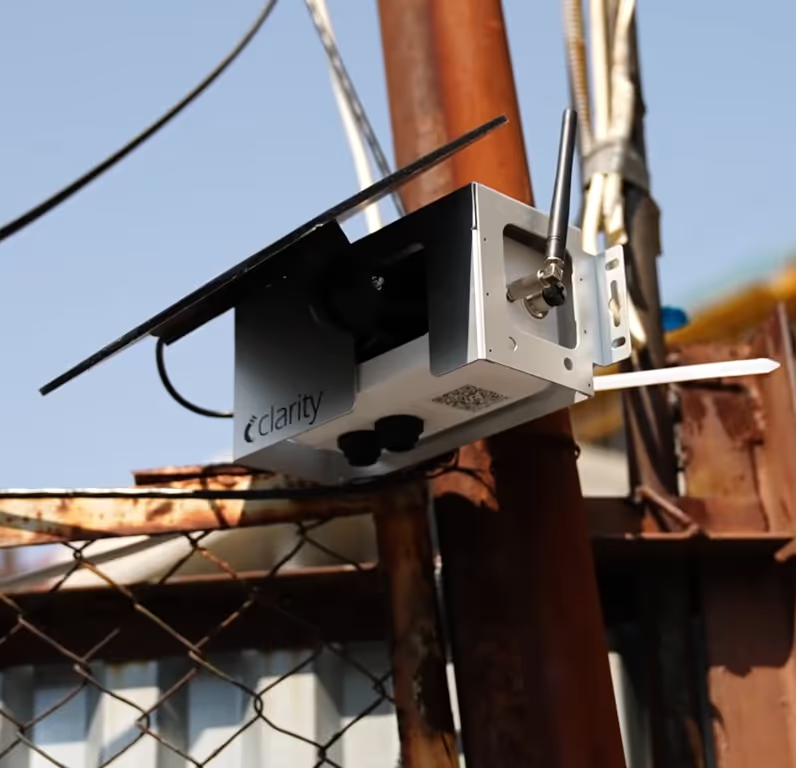
Clarity Node-S solar-powered air quality sensor for data center fenceline monitoring of PM2.5 and NO2

Clarity Node-S Core sensor

PM2.5 and NO₂, the two headline generator pollutants

The solar-powered, cellular-connected sensor at the center of every deployment. It installs in about 10 minutes with a Phillips screwdriver, runs 30 days without sun on its battery, has no filters or pumps to service, and ships with remote calibration built in. MCERTS-certified for PM2.5.

PM2.5NO₂TemperatureHumidity
Learn more about the Node-S →
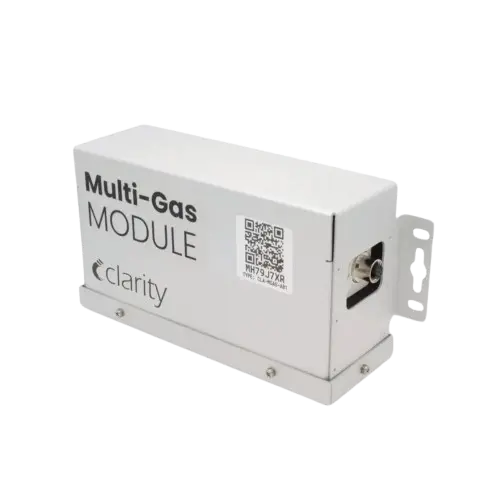
Clarity Multi-Gas Module for measuring CO, O3, NO, and NOx from data center backup generators

Multi-Gas Module

CO, O₃, NO, and NOₓ

Backup generators emit more than particles. Add the gases named in NAAQS, NSPS, and NESHAP so your monitoring data speaks the same language as your air permit, without replacing the reference methods it specifies. Runs on Node-S solar power, fully off-grid.

Learn more →
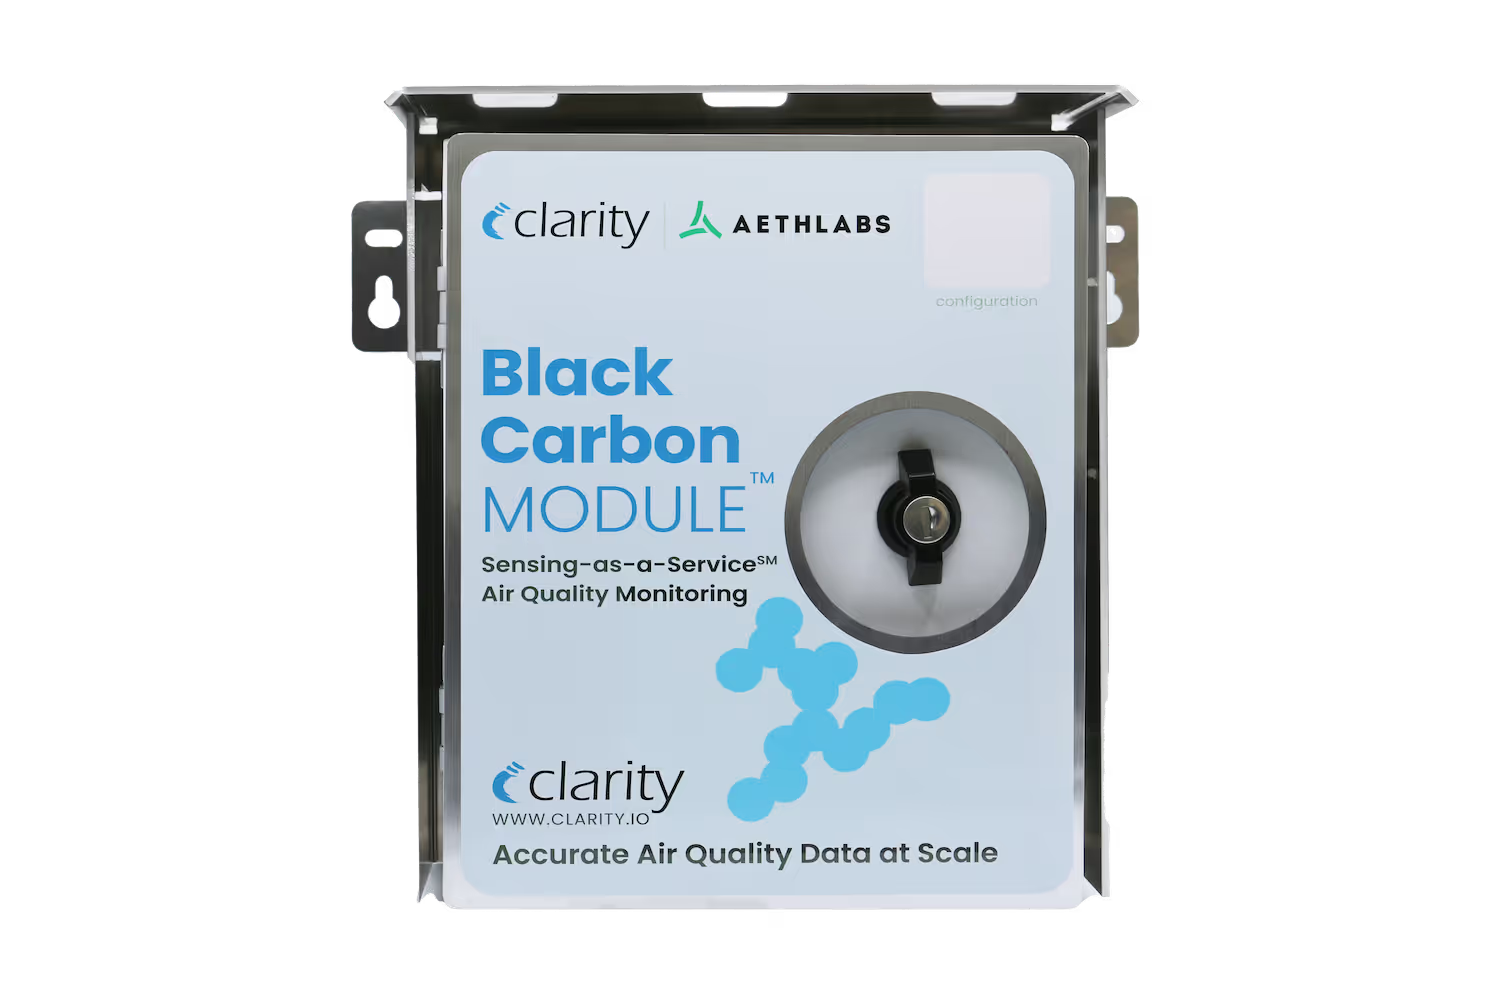
Clarity Black Carbon Module for identifying diesel generator soot at data centers

Black Carbon Module

Fingerprint diesel generator soot

Five-wavelength optical analysis separates fossil-fuel black carbon from biomass smoke, so you can tell generator emissions apart from traffic, wildfire, or regional background. Requires external power.

Learn more →
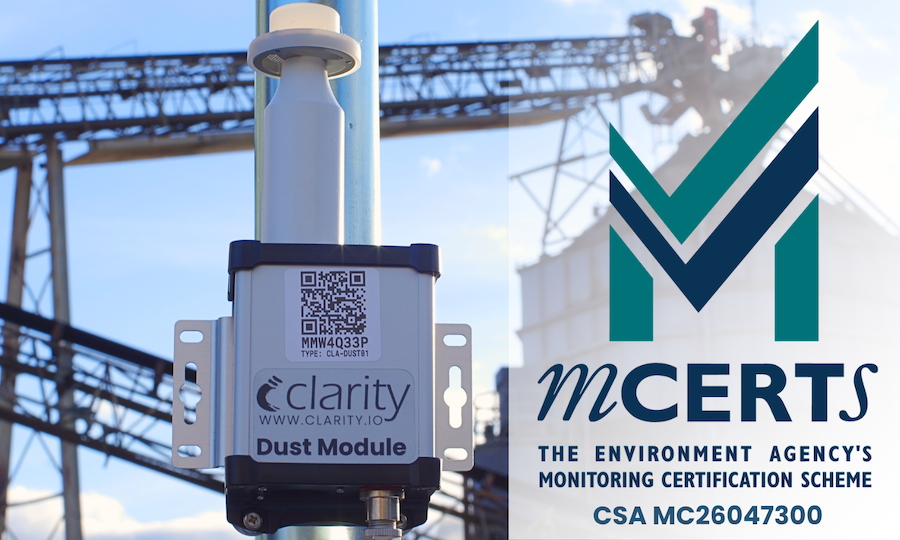
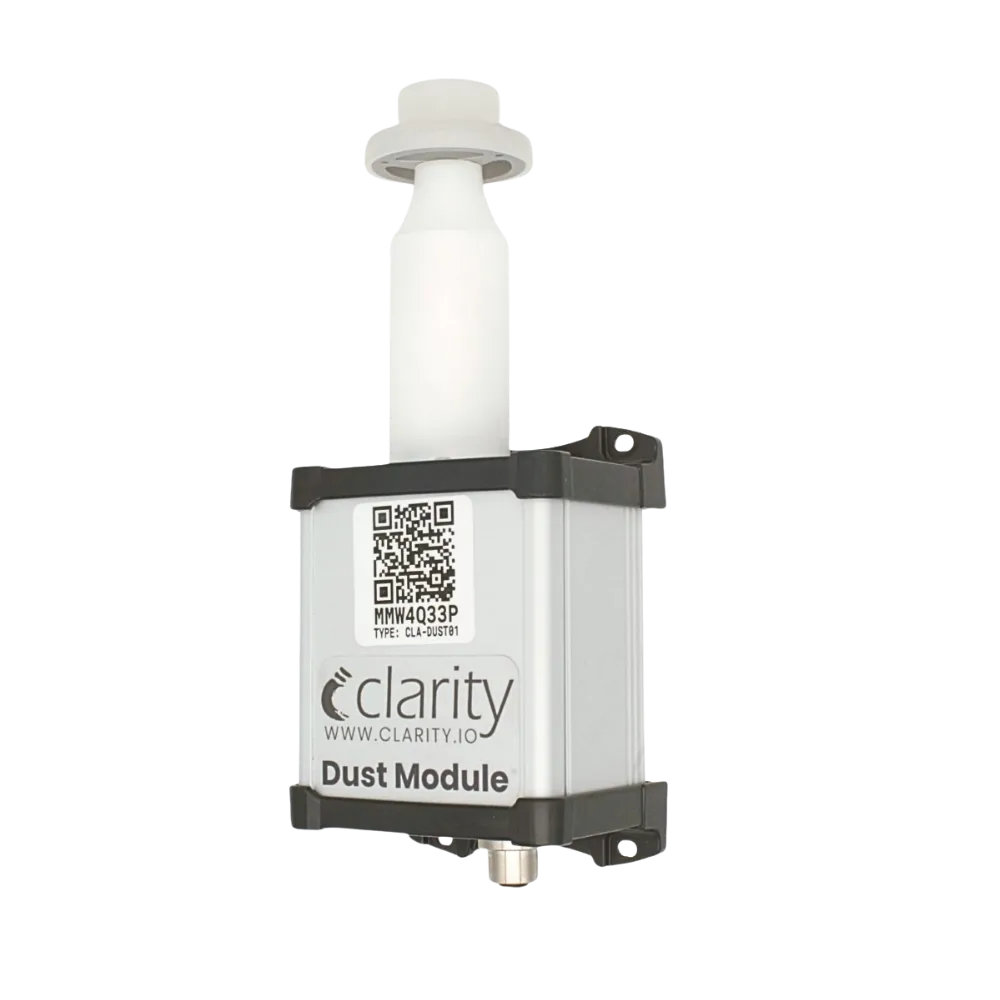
Clarity Dust Module for PM10 monitoring during data center construction and operations

Dust Module

PM10 for construction and operations

New builds and site work kick up coarse dust that standard optical sensors underestimate. Enhanced optics and a heated inlet deliver PM10 designed for industrial fenceline sites. Requires external power.

Learn more →
Clarity Wind Module ultrasonic anemometer for linking emission spikes to generator runtime and wind direction

Wind Module

Link spikes to generator runtime

Ultrasonic wind speed and direction, plus temperature, humidity, and pressure. The Dashboard builds pollution roses automatically so you can attribute a spike to a generator test hour or to an upwind source.

Learn more →
Clarity OpenMap public air quality map sharing real-time data center emissions data with the community

OpenMap

Public, custom-branded transparency

Publish hourly readings to a map your community can open, embed widgets on your own site, and keep everything else private. OpenMap Plus adds white-label branding, a network-bounded view, and alerts.

Learn more →

Not sure which you need?

Our team will scope a monitoring bundle around your permit obligations, site layout, and budget, then send a quote.

Request a Quote
Why Clarity

Why Clarity for data center air quality monitoring

Off-grid, low-maintenance fenceline deployment

Solar power and cellular data mean a Node-S mounts anywhere on the perimeter in minutes. No trenching, no Wi-Fi, no scheduled maintenance, and device health is watched remotely.

Multi-pollutant coverage for permit reporting

PM2.5 and NO₂ at the core, plus modular NOₓ, CO, O₃, black carbon, and PM10: the same parameters NAAQS, NSPS, and NESHAP address for stationary engines and turbines, measured continuously to complement the reference monitoring your permit requires.

Calibrated, defensible data you own

Global calibration models built from hundreds of collocated sensors, collocation support, and per-sensor performance metrics you can cite. Your data stays private unless you choose to publish it.

Community transparency and ESG

A custom-branded OpenMap turns your network into a public trust signal: real-time air data for neighbors, officials, and sustainability reports.

Sensing-as-a-Service

Hardware, cloud software, cellular data, calibration, and a dedicated environmental project manager in one annual subscription. Malfunctioning devices are replaced free of charge.

Proven at the industrial fenceline

From copper mines and refinery-adjacent communities to the largest urban networks in the US and UK, we have designed perimeter networks whose data third-party auditors and authorities have praised.

Data center air quality monitoring FAQ

Backup diesel generators are the main source of data center air emissions, and a single campus can hold dozens of them. Continuous monitoring documents what those generators release during testing and outages, informs air permit applications and reporting alongside the reference monitoring the Clean Air Act requires, and helps protect servers from corrosive gases and dust. It also gives operators credible numbers for ESG reporting and for conversations with fenceline communities, which increasingly decide whether a project gets approved.

In the United States, the Clean Air Act (CAA) is the umbrella. The National Ambient Air Quality Standards (NAAQS) set limits for six criteria pollutants: CO, NO₂, O₃, particulate matter, SO₂, and lead. New Source Performance Standards (NSPS) regulate stationary combustion turbines and compression-ignition engines for NOₓ, PM, CO, and VOCs, and NESHAP limits hazardous air pollutants such as formaldehyde and benzene from the same equipment. Sites in nonattainment areas often face stricter permit conditions, and some states add their own rules for backup generator runtime.

Start with PM2.5 and NO₂, the two pollutants most closely tied to diesel combustion and to NAAQS attainment. Add NOₓ and CO to match NSPS permit language, and O₃ where regional ozone is a concern. Black carbon is the most direct fingerprint of diesel soot and helps separate generator emissions from traffic, and PM10 matters during construction. Wind speed and direction turn all of it into source attribution.

Generator emissions are intermittent and hyperlocal. A test run lasts an hour, and the plume settles within a few hundred meters, so a regional reference monitor several miles away records nothing. Fenceline sensors placed downwind capture the actual exposure at the property line, in real time, and create a continuous record you can put in front of a regulator or a neighbor. Owning that record is far better than relying on someone else's estimate.

Define your objectives first (permit support, community transparency, ESG reporting, or all three), then set a budget and decide how professional-grade sensors will complement any reference-grade monitors your permit requires. Plan siting around prevailing winds, generator locations, and where people live. Deploy, collocate against a reference monitor to document performance, and act on the data. Our environmental project managers handle network design, calibration, and ongoing device health for every subscription.

ESG reports are only as credible as the measurements behind them, and continuous fenceline data replaces estimates with observed values. Publishing that data on a branded OpenMap lets neighbors, officials, and investors see the same readings you see, in real time. Communities that can check the data themselves are far more likely to support the next expansion.

Clarity sells monitoring as Sensing-as-a-Service: one annual subscription that bundles the hardware, cloud software, cellular data, calibration, automated quality control, and a dedicated environmental project manager. There are no per-device software licenses, no separate connectivity fees, and malfunctioning devices are replaced free of charge. Total cost depends on how many sensors your perimeter needs and which add-on modules your permit calls for, so the fastest way to a number is to request a quote and let us scope the network with you.

Request a quote

Put fenceline monitoring in place

Tell us about your site and a Clarity air quality expert will scope a sensor network around your permit obligations, layout, and budget. We reply within one business day.

  • Deploys anywhere on site. Solar-powered and cellular, installed in about 10 minutes per location.
  • Multi-pollutant. PM2.5 and NO₂ natively, plus modular NOₓ, CO, O₃, black carbon, PM10, and wind.
  • Data you own. Private by default, with a public OpenMap when you want it for ESG and community trust.

Request a quote

Request a quote for a custom fenceline monitoring network today.

Prefer to talk? Talk to an air quality expert

Keep reading

View all articles

Guides and research on data center emissions, fenceline monitoring, and the standards that apply to backup generators.

Explore

Other use cases

The same fenceline approach, applied to other sources of local air pollution.

Can’t find the resource you need?

Contact Us