
TL;DR — Particulate matter (PM) is a highly prevalent and impactful air pollutant around the world. Particulate matter pollution results primarily from combustion, including industrial activities, vehicles, and wildfires. Particulate matter differs greatly in its concentration and composition across the world, but has a significant impact on public health in most countries. It is classified according to the size of its particles, the smaller categorization of which — PM2.5 — accounts for much of the pollutant’s detrimental effect on human and environmental health. Although the effects of PM are well studied, it remains in excess of benchmark levels for a large majority of the world’s population, prompting the need to take action in order to achieve cleaner air.
What is particulate matter?
Particulate matter composition
Particulate matter is not composed of a single substance, but rather a combination of solid and liquid particles such as dust, pollen, ash, soot, dirt, and smoke. Some of these particles may be visible, such as by the appearance of haze, and others are too small to see with the naked eye.
Particulate matter is commonly divided into four categories based on the size of its particles: Coarse, PM10, PM2.5, and PM1. Coarse PM particles are 10 micrometers (μm) or bigger, while PM 10 and PM2.5 consists of particles that are 10 or 2.5 μm or smaller in diameter, respectively. Both PM10 and PM2.5 are considered inhalable particles, meaning that they are small enough to be inhaled deep into the lungs.
PM1 consists of the smallest particles: those under 1 micrometer in diameter. Though it may potentially be more harmful to human health due to its small size, there is limited evidence of its negative health effects because of the lack of widespread monitoring or regulation — PM1 is not monitored as routinely as PM2.5 or PM10 as it is not a subject of most air quality standards. However, it is theorized that PM1 may contribute to a significant portion of PM2.5’s health effects because of its small particle size.

Types of particulate matter: PM1, PM2.5, PM10 and coarse PM
Particulate matter is classified by particle diameter. Smaller particles penetrate deeper into the respiratory tract and pose the greatest health risk.
Sources of particulate matter
Particulate matter air pollution can come from both human-made (anthropogenic) sources and natural sources.
Human-made (anthropogenic) sources
Particulate matter is primarily emitted by combustion sources, such as vehicles, diesel engines, and industrial facilities. PM can be generated from both primary and secondary sources — primary sources include construction sites, unpaved roads, fires, smokestacks, and wood stoves, all of which directly emit particulate matter. Coarser particulate matter may also be stirred up from certain soil-disrupting activities, such as road travel or agricultural operations, contributing to overall PM levels.
In contrast, secondary sources let off gases that react to form PM in the atmosphere. Certain pollutants from other pollution sources — for example, sulfur dioxide and nitrogen oxides, which may be emitted from power plants or coal fires — interact in the atmosphere in complex chemical reactions to form particulate matter. Gaseous particles can also cool into solid or liquid particles in the air.
Particulate matter tends to be found in higher concentrations in urban areas than in rural areas. One study compares the number of “PM days” — days when PM2.5 levels are greater than the target 24-hour average set by the National Ambient Air Quality Standards (NAAQS) — and found a mean of 11.21 days in large central metropolitan counties as compared to only 0.95 days in rural counties. PM2.5 was also observed at higher concentrations in the central counties, where there was a higher density of people and activities that contribute to particulate matter pollution.
Natural sources of particulate matter
While particulate matter (PM) pollution is most commonly associated with human activity, a variety of natural processes contribute to PM levels in the atmosphere. Sand and dust storms occur when high winds lift particles from dry, sparsely vegetated regions, producing both PM2.5 and PM10 that can travel thousands of kilometers.
Seaspray from coastal areas similarly releases salt aerosols into the air, which can have both positive and negative effects on the atmosphere and human health, depending on the cleanliness of the source water. Plant and fungal matter can drift as bioaerosols and trigger allergic reactions and asthma when inhaled.
Wildfires are another significant natural source. They emit harmful PM2.5 and PM10 in the form of ash, along with black carbon, which is a potent climate forcing agent. Finally, volcanic eruptions produce particulate matter in the form of ash and lava fragments that can spread hundreds or thousands of miles and linger as a source of PM10 pollution for days, weeks, or even months after an eruption.
Why particulate matter matters: health & environmental impacts
How particulate matter impacts human health
The negative health effects associated with exposure to particulate matter are significant. A 2021 Harvard study found that particulate matter air pollution from burning fossil fuels was responsible for 10.2 million global excess deaths in 2012. The methods used in the study allowed researchers to link premature deaths from PM2.5 exposure to fossil fuel combustion, attributing this as the cause for 1 in 5 premature deaths worldwide. The same study estimates that 350,000 premature deaths associated with fossil fuel pollution occurred in the United States in 2018.
Many of the negative health effects from PM are due to the small size of its particles, which can enter the body, move into the airways and lungs, and even enter the bloodstream.

Source: European Environment Agency
PM2.5 poses the greatest health risk because its particles are even smaller than those of PM10 — PM10 particles tend to collect in the upper respiratory tract, while PM2.5 has the ability to penetrate into the lungs, damage lung tissue, and move further into the body.
Short-term exposure to PM for hours or days can aggravate lung disease, cause asthma attacks and acute bronchitis, and increase susceptibility to respiratory infection. Long-term exposure — meaning living for years in an area with high PM concentrations — is associated with reduced lung function, chronic bronchitis, and premature death.
PM exposure is especially dangerous for children for a variety of reasons: their respiratory systems are still developing, they breathe more air per pound of body weight than adults, and they are more likely to be active outdoors. Individuals with existing heart or lung disease are also at risk for greater health impacts.
Studies have also found that exposure to particulate matter pollution can affect the brain. In children, PM exposure can alter the size of the brain as it develops, which may increase the risk for cognitive and emotional problems later in life.
Research has also demonstrated a link between particulate matter exposure and dementia. A 2017 USC study found that for those living in areas with PM2.5 exposure greater than the standard set by USEPA (12 µg/m³), the risk for dementia in older women nearly doubled. If these findings are extrapolated to the general population, PM pollution exposure would be responsible for about 21% of dementia cases worldwide, according to the study’s lead researcher, epidemiologist Jiu-Chiuan Chen.
A 2019 study out of USC looked at the effects of PM exposure on Alzheimer’s Disease specifically and found that women in their 70s and 80s who had previously been exposed to higher levels of PM2.5 experienced greater Alzheimer’s-like brain atrophy and greater declines in memory, compared to those who had breathed cleaner air.
Environmental impacts of particulate matter pollution
Particulate matter can be transported long distances by wind and settle in areas far from where it was initially emitted. This means effects from a PM-emitting event — such as a large wildfire — can have significant impacts on air quality across a wide geographical area. To learn more about how wildfires dramatically impact air quality, primarily through the release of high amounts of particulate matter, read our wildfire blog here.
Particulate matter is also responsible for haze in the air, resulting in reduced visibility, which is not uncommon now, particularly in large cities.

High amounts of particulate matter can also alter overall environmental health by making lakes and streams acidic, changing nutrient balance in coastal waters and large river basins, depleting soil nutrients, damaging forests and crops, contributing to acid rain, and affecting ecosystem diversity.
Particulate matter standards and global prevalence
What are safe levels of PM2.5? WHO vs. US EPA
Globally, the World Health Organization (WHO) provides benchmarks and recommendations for acceptable PM levels. The 2021 WHO Global Air Quality Guidelines have set the AQG level for PM2.5 at 5 µg/m³ (annual mean) and 15 µg/m³ (24-hour mean). For PM10, these numbers are 15 µg/m³ and 45 µg/m³, respectively. For countries that exceed these recommended maximum levels of PM pollution, the WHO establishes interim targets to gradually decrease the amount of pollution released until it can be considered clean air by WHO targets.
At smaller scales, national and regional agencies are responsible for regulating PM pollution in different areas. Such organizations include the USEPA and the EU, which set targets in their respective regions.
In the United States, the USEPA regulates the level of “inhalable” particles outdoors, including PM2.5 and PM10, but not including particles over 10 μm in diameter. Particulate matter is regulated under the National Ambient Air Quality Standards (NAAQS) as one of the six criteria pollutants. The Clean Air Act requires USEPA to set standards for these six criteria pollutants, which are considered to be harmful to both human health and the environment.
Both primary and secondary standards are set by the USEPA for PM regulation. Primary standards are set with the intent to protect public health, particularly the health of sensitive populations such as children, the elderly, and those with asthma. Secondary standards are meant to protect public welfare and the environment, limit occurrences of decreased visibility, and avoid damage to animals, crops, vegetation, and buildings.
These standards include both 24-hour and annual standards for PM2.5 and PM10. Currently, the EPA has primary and secondary standards for PM2.5 with levels of 9.0 µg/m³ and 15.0 µg/m³ (annual average), respectively.
In addition to global and regional targets, we are beginning to see PM regulated at the more local level — in the places where people live and work. Recent rules in California, Washington, and Oregon have put measures in place requiring employers with outdoor workers to monitor air quality and take action to protect employees, with a requirement to eliminate or reduce their wildfire smoke exposure when the AQI reaches 151 or above.
PM prevalence around the world
The concentration and distribution of PM pollution around the world vary both spatially and across time.
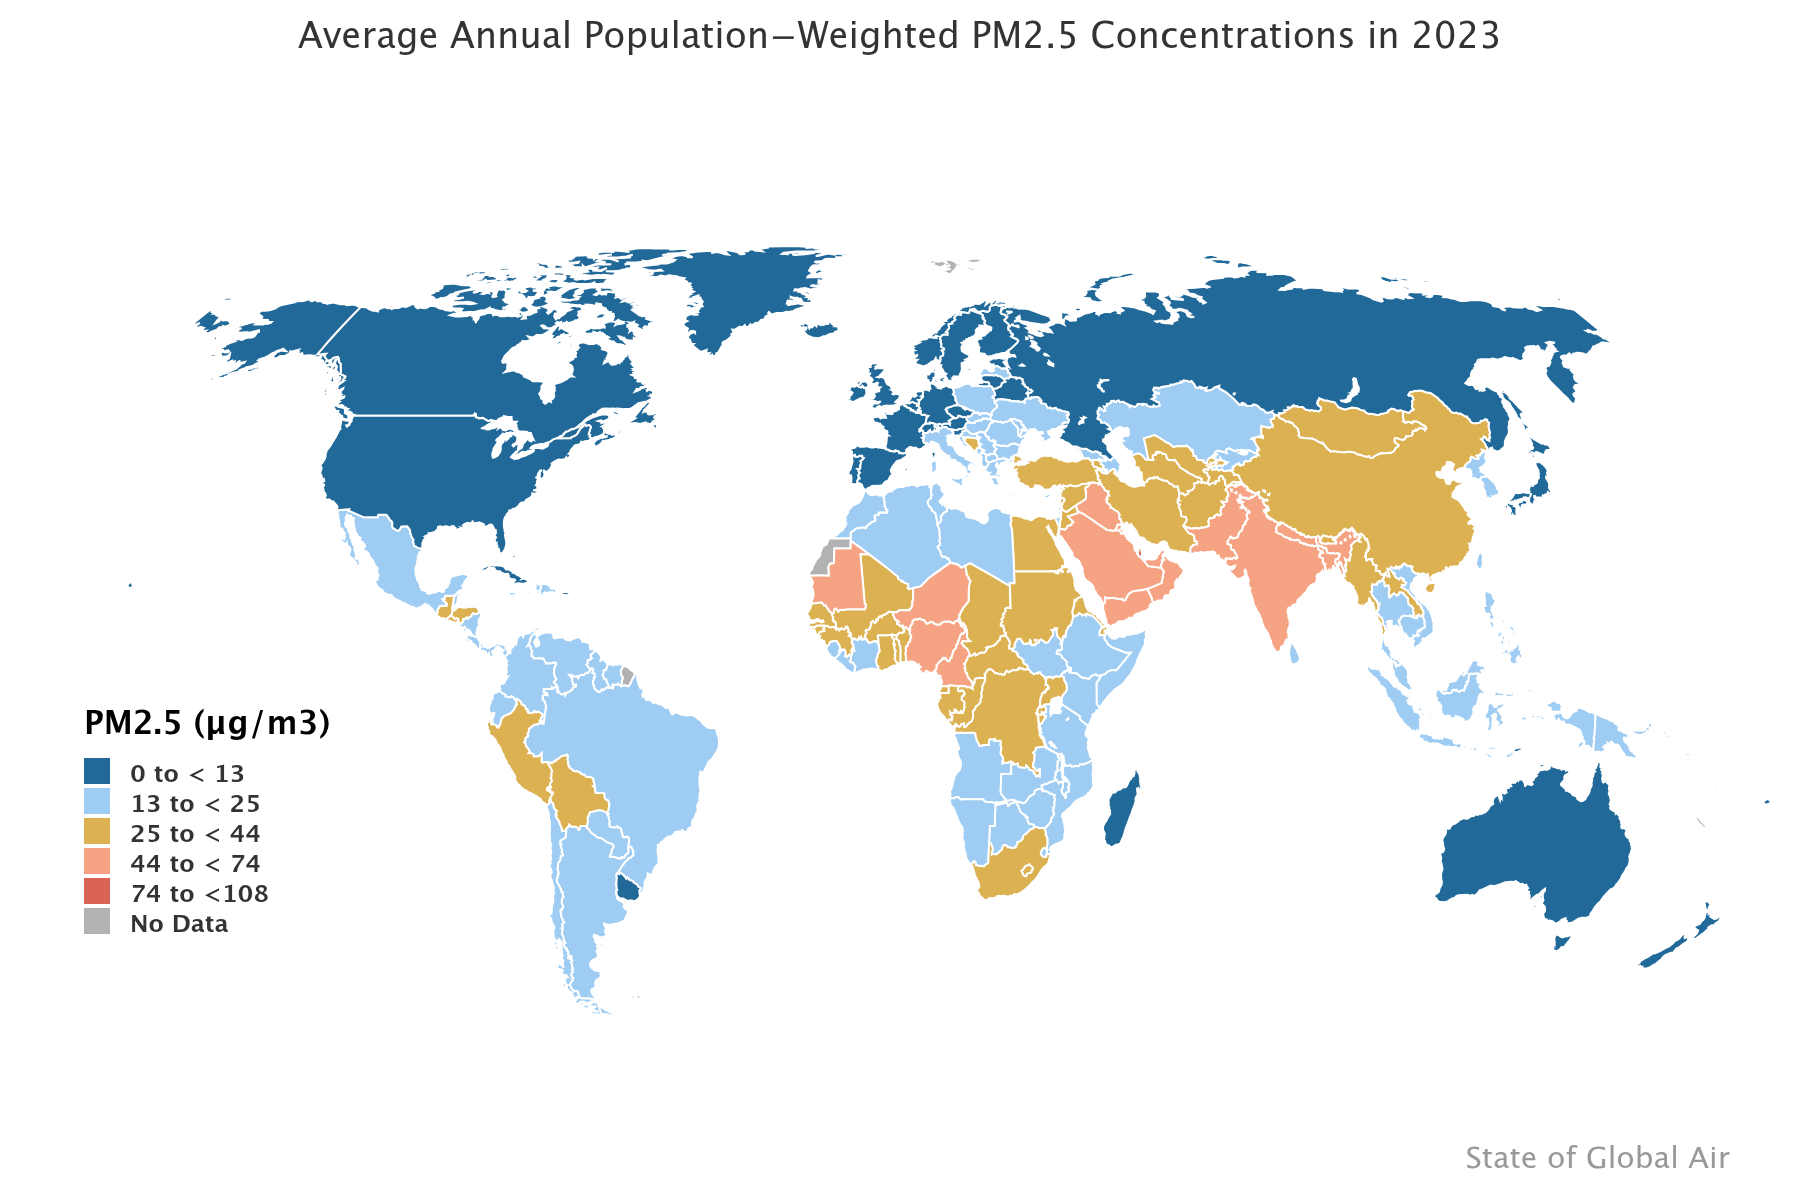
This State of Global Air graphic shows the population-weighted annual average PM2.5 concentrations in 2023. One study using 2021 WHO data found that 80% of those directly exposed to unsafe average annual PM2.5 concentrations live in low- and middle-income countries.
An alarming 91% of the world’s population lives in areas where PM2.5 levels exceed the WHO’s benchmarks for healthy air. Approximately 4 billion people live in areas where the mean annual concentrations of PM2.5 do not meet the WHO’s least stringent target of 35 µg/m³.
The WHO states that long-term exposure for those living above an annual average PM2.5 concentration of 10 µg/m³ has a higher risk of death from lung cancer and cardiopulmonary issues. Based on this criterion, over 90% of the global population is exposed to unhealthy air.


The second image displays PM2.5 air pollution levels from 1990 to 2017 in various regions of the world. A high majority of the world’s population does not live in areas where PM2.5 concentrations are low enough to be considered healthy air. Most of the regions of the world experience highly polluted air, with the highest levels seen in South Asia, the Middle East and North Africa, and Sub-Saharan Africa in recent years.
(Image source: The World Bank)
In contrast, PM2.5 levels have seen slight decreases in the United States. However, these numbers only account for the national average of PM2.5 concentrations and do not reflect localized trends or heightened levels within specific communities. Many areas within the United States are still exposed to unhealthy levels of PM pollution.

How particulate matter is measured and monitored
How particulate matter is measured
The instruments most commonly used to measure particulate matter do so either by measuring PM concentration or particle size distribution.
The most accurate measurement uses a gravimetric method by drawing air onto a filter where particles can collect. The filter is then weighed and compared to its original weight before the air was drawn in. Because the particles are directly collected, this method also allows them to be chemically analyzed to learn more about their composition.
This measurement method is used by regulatory bodies such as the EU and USEPA due to its high standard for data accuracy. However, because of the process to collect and weigh the filters, it does not allow for real-time data and can only provide an average value for the time period that it was deployed. This method also comes with high operational costs since trained staff are needed to operate the instruments.

How is PM2.5 monitored in real time?
Particulate matter can also be measured using optical instruments by looking at different properties of light, including light scattering, light absorption, and light extinction, and how they react to the presence of particles. An optical particle counter (OPC) is the most popular of these methods and uses a light source like a laser diode to illuminate the particles and a photodetector to measure the light scattered as a result of these particles.
OPC-based sensors, such as Clarity’s Node-S, are generally more affordable than gravimetric methods and allow for near real-time measurement of particulate matter. An OPC can be calibrated and verified against FRM and FEM instruments such as a USEPA reference-grade monitor to increase its accuracy. They can be deployed in large numbers to form dense air quality monitoring networks that can identify air pollution hotspots and inequalities.
Particulate matter is generally expressed in micrograms per cubic meter (µg/m³) to show its concentration in the air. The Air Quality Index (AQI) for PM is often used to communicate what this concentration means, dividing air quality into six categories based on the level of health concern associated with the present pollution.
Use cases for measuring PM
Particulate matter is often measured and communicated to serve as a proxy for overall air quality, especially through the AQI for PM2.5. PM can also be measured to investigate the level of air pollution associated with certain activities, such as construction and mining.
Construction sites can also emit a high concentration of air pollutants, so measuring particulate matter can help quantify the overall air pollution emissions from the site.
Measuring PM can help determine the air pollution coming from mining activities. Particulate matter is released during surface mining, as well as when soil and vegetation are removed, exposing the soil to weather which can cause particles to become airborne. PM measurement devices can help quantify the impacts that mining has on overall air quality.
PM is also the dominant pollutant accounting for the danger of wildfire smoke to human health, so measuring the level of particulate matter released by wildfires can help both categorize the wildfire’s impacts on air quality and help inform individuals of the danger that the air poses at a given moment.
Real-world ambient PM2.5 monitoring in action with 2 case studies
NIWA, New Zealand
New Zealand's National Institute of Water and Atmospheric Research (NIWA) has deployed networks of Clarity Node-S sensors across towns and urban areas throughout New Zealand to map PM2.5 pollution at block-by-block resolution. This is a level of spatial detail impossible to achieve with sparse reference stations.
In one project, NIWA deployed over 40 Node-S sensors to monitor wintertime woodsmoke pollution across a single town. The resulting data reveal PM2.5 concentrations in hotspots and provide insights to inform the development of New Zealand's first nationwide residential woodsmoke forecasting model.
We needed high-density data to develop a model that was representative of a real situation on a very local scale – so multiple devices and multiple locations. The Clarity Node-S was ideal for this use case."
— Dr. Ian Longley, Principal Scientist - Air Quality, National Institute of Water and Atmospheric Research
Breathe Accra, Ghana
Breathe Accra is a community-driven air quality initiative operating across the Greater Accra Metropolitan Area, which is home to more than 5 million people. In 2023, the harmful particulate matter levels in Accra were four times higher than what health experts recommended. Led by Professor Kofi Amegah at the University of Cape Coast and supported by the Clean Air Fund, the project has deployed 15 Clarity air quality sensors in the Breathe Accra Network. Under the broader GhanaAQ project, there are 12 additional Clarity air quality sensors in other urban areas across Ghana.
The data is made openly accessible to the public via the Breathe Accra website and the GhanaAQ mobile app, and is actively being used to raise awareness at municipal assembly meetings. Researchers estimate that 1,790 deaths per year in the region could be prevented if the WHO air quality guidelines are met.
The impact has been enormous, and it will continue to be so. We can’t discount the fact that the Clarity sensors have been instrumental to the impact that we are achieving. The sensors are very reliable, and the measurements are continuous."
— Professor Kofi Amegah, Project Lead
How Clarity takes charge of particulate matter pollution
Clarity employs OPC technology and a proprietary calibration method to accurately measure PM10, PM2.5, and PM1 at the local level, helping to paint a complete picture of the particulate matter pollution in a given location. If you are interested in affordably and precisely monitoring particulate matter, you can learn more about our solution here.