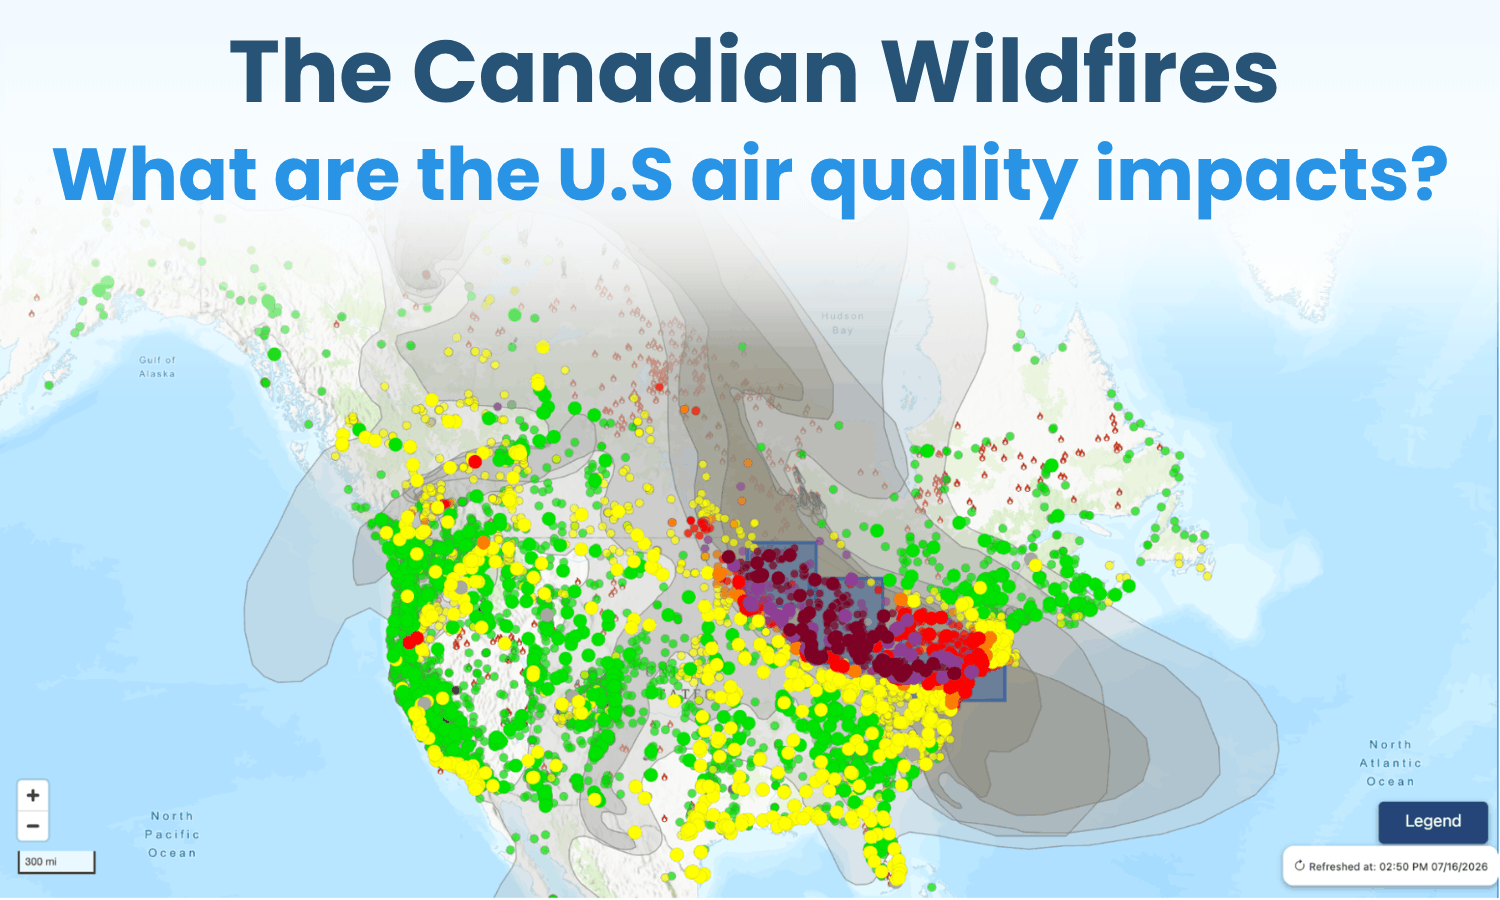
This image is a screenshot from the AirNow Fire and Smoke Map taken at 2:50 pm on Thursday, July 16th. It shows the Canadian wildfires, smoke plumes, and air quality AQI readings across the United States and Canada.
Events like this show how fast transported smoke can overwhelm a region, and on September 30, 2026 Clarity’s co-founders will preview the new capabilities built to keep sensor networks reporting and mapping smoke through exactly these conditions, so register for the free 30-minute session here.
TL;DR: This week's wildfire smoke event shows how quickly conditions can shift for millions of people far from the fires themselves, as smoke from nearly 900 active Canadian blazes and Minnesota fires drifted across the Northeastern U.S. Beyond the visible orange skies, the air pollution carries real health risks, compounded by summer heat, underscoring why real-time, neighborhood-level air quality monitoring has become an essential public health tool during wildfire season. Clarity’s sensor networks in cities like Chicago and Detroit registered air pollution levels ranging from the “unhealthy” to the “hazardous” territory.
The Canadian wildfires
This year, roughly 3,500 fires have enveloped about 2.3 million acres of land across Canada. While this statistic is shocking, it is actually in line with Canada’s ten-year average for this time of year. Climate change has been drastically shaping the wildfire landscape.
The direct causes of each wildfire vary from lightning to human activity, but underlying factors such as dry vegetation, drought conditions, and heat have been contributing to the country’s blazes. As of July 16th 2026, 876 active fires are burning across Canada. As of July 17th, many of these fires remained out of control, with some new ones sparking to life.

More than 180 fires burned in Ontario, Canada, as of July 16th. Here, fires have largely been concentrated around Thunder Bay, a city near Lake Superior. Yet, flames have also touched Fort Frances, Nipigon, Dryden, and Sioux Lookout.
Eight blazes in Northwest Ontario saw significant growth on July 13th and 14th. As of Thursday, at least 15 rural communities in Ontario have been evacuated, and more than 150 fire crews have been working tirelessly to abate the flames.
The spread of wildfire smoke air pollution
Canadian wildfire smoke has combined with smoke from Minnesota fires, spreading across Southern Canada and throughout much of the Northeastern United States. Winds have been pushing smoke from fires in Ontario Eastward. As a result, millions of Americans across more than 20 states, from Minnesota to New York, have experienced unhealthy air. Some areas have even faced air quality conditions that are considered well beyond hazardous.

The smoke has tinted the sky orange, grey, and yellow in many areas, including New York and Chicago. Negative health effects accompany these changes, especially when the smoke drifts closer to ground level. In Toronto, two hospitals showed an 80% increase in emergency room visits on Wednesday, possibly related to the smoke.
Which major cities are seeing the most impact from the Canadian wildfires?
A note on open data & privacy
The readings included here come only from sensors that our clients have chosen to configure for open data sharing, opting in to our OpenMap and/or Open Data API. Our customers fully own their data, and Clarity does not co-own the data. See Clarity’s Data Promise here for more.
Clarity Movement’s sensors have been able to capture how wildfire smoke has spread across several highly populated United States cities. The table below shows the top 5 highest readings recorded by our solar-powered air pollution sensors across the United States over the past few days*.
Across Clarity's open-data sensors in the United States, wildfire smoke pushed air quality into unhealthy and hazardous territory on July 16 and 17, 2026. The worst readings clustered in the Upper Midwest and around the Great Lakes, where Canadian wildfire smoke settled over the region. Chicago recorded the single highest reading in the network, a 1-hour PM2.5 of 471.8 µg/m³ (AQI 481), followed by the Detroit metro area at Detroit and Grosse Pointe, Ann Arbor, and the Cleveland suburb of Shaker Heights. Each of these sites climbed above AQI 400, into the hazardous range.

Two western sites tell a separate story. Spokane, Washington, and Burns, Oregon, both spiked from local wildfires burning in the Pacific Northwest, independent of the Canadian smoke driving the Midwest readings. Their peaks arrived in the early morning of July 17, several hours after the Midwest sites, which fits regional fire activity rather than the same transported plume.
Along the East Coast the smoke thinned before it reached the seaboard, so Philadelphia and New York stayed lower while still reaching the unhealthy range at AQI 308 and 237. Every site in the top 10 passed AQI 200, the level at which agencies advise everyone, not only sensitive groups, to limit time outdoors.
For instance, the Open Air Chicago network, which contains over 277 Node-S sensors, captured the deteriorating air quality throughout the city. At certain points on Thursday, July 16th, nearly all of the sensors across the city were registering “Hazardous” levels of air pollution.

The Breathe Philly network, which contains over 70 Node-S air quality sensors, similarly registered wildfire smoke-related air pollution throughout Philadelphia.

Conditions worsened in Washington, DC, between Thursday and Friday, with measurements being captured by the Washington, DC Clarity Node Project, run by the Department of Energy and Environment (DOEE).

Clarity sensors are also used by an air quality monitoring network run by the City of Detroit and a small neighboring network in Ann Arbor. Both networks recorded harmful air quality conditions on Thursday and Friday.

How to stay safe amidst wildfire smoke
Fortunately, there are steps that you can take to stay safe during ambient smoky conditions. Clarity has put together a 2026 wildfire season guide, including a wildfire safety checklist you can download here.
Be sure to always check your local air quality. Real-time air quality index (AQI) readings can be found on the AirNow Fire and Smoke Map as well as the Clarity OpenMap. The different AQI categories come with specific safety recommendations that you should follow. When the AQI is in the “Unhealthy” range or worse, the best thing you can do is try to limit time outdoors and run an air purifier inside.

If you have asthma or another respiratory condition, you may want to take extra precautions, even when the AQI is under 150. Children, pregnant women, and elderly individuals are also more sensitive to air pollution.
When in doubt, always follow official recommendations. Over the last few days, officials in areas such as New York, which have been experiencing very unhealthy conditions, have been recommending staying indoors, running air purifiers, and wearing N95/KN95 masks when going outdoors is unavoidable. Be sure to seal off your home from smoke as much as possible by closing windows and running the AC (after closing the fresh air intake).

Another factor to take into account is the heat. During this summer’s hot weather, watch out for heat-related health effects in addition to smoke-related health effects to remain safe on both fronts.
The importance of air quality monitoring for wildfires
Air quality monitoring is one of the most important public health tools during wildfire season. It is impossible to properly manage something that you do not understand. Accurate air quality monitoring provides this valuable knowledge, helping governments and individuals determine the right actions to take to stay safe.
Dense networks of air quality sensors designed for real-time wildfire smoke monitoring help capture neighborhood-level changes, ensuring that more people understand the air that they breathe. Real-time data ensures that everyone is updated during rapidly changing wildfire and weather conditions.
Wildfire smoke monitoring with Clarity
Clarity’s air quality sensors have already helped inform and protect people from wildfire smoke through networks such as San Francisco’s Brightline Defense network and the Los Angeles Unified School District (LAUSD) network.
Partner with Clarity to set up a wildfire smoke air quality monitoring network in your city to safeguard public health amidst wildfire smoke events.