
Image by Norman Meyer on Unsplash
As fire seasons intensify, so must the tools we use to track them, so bring your questions to a live 30-minute Q&A with Clarity co-founders David Lu and Paolo Micalizzi on September 30, 2026 and get a first look at what's next for wildfire smoke monitoring.
TL;DR: Wildfires are becoming more frequent and severe, with fire seasons starting earlier and lasting longer. Human activity, climate change, and expanding wildland-urban areas all lead to more devastation. The past ten years in North America have seen record-breaking fire seasons. These fires are not only destroying land and property but also releasing hazardous smoke, affecting air quality and public health.
Over the past 21 years, the most extreme wildfires on Earth have become more frequent, more intense, and larger. Carbon emissions from forest fires rose 60% globally between 2001 and 2023, and emissions from boreal forests in Eurasia and North America nearly tripled over the same period.
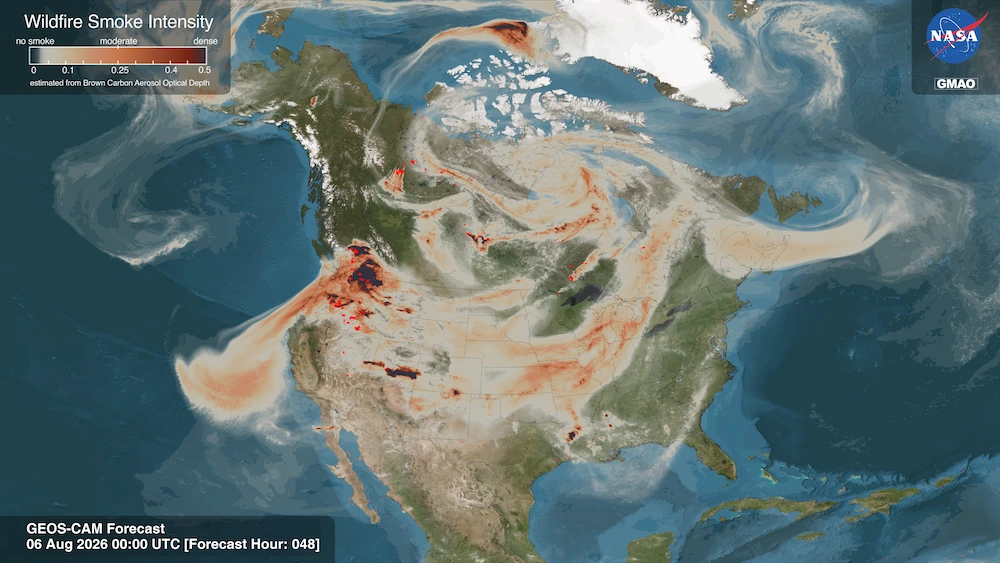
2026 is showing what that looks like on the ground. By late August, wildfires had burned more than 7.9 million acres across the United States, 165% of the 10-year average, and Canada was 4.1 million hectares into a season that followed its second-worst year on record.
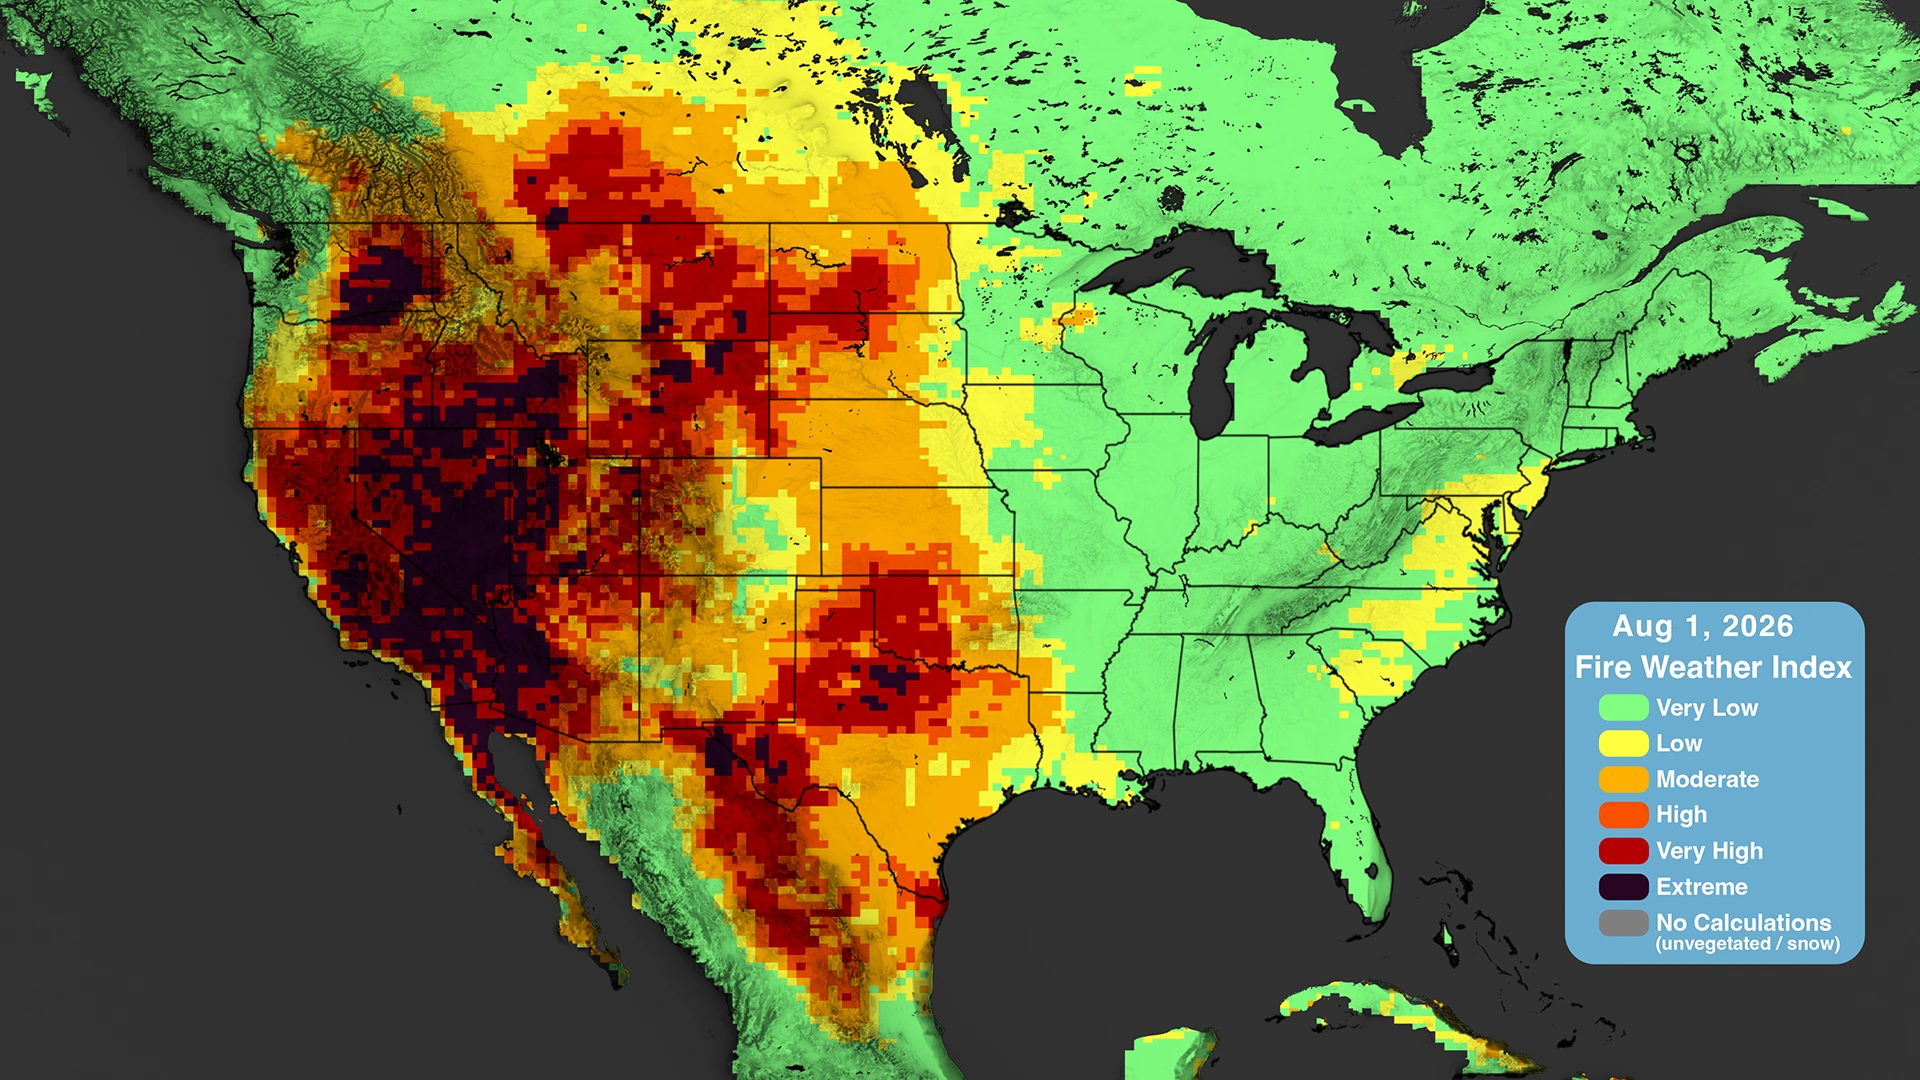
Wildfire seasons are growing longer, starting earlier in the spring and extending later into the autumn months. Much of this natural devastation is caused by human activity and emissions, which contribute to global warming. With this in mind, it is worth taking a closer look at exactly how this is happening and what can be done about it.
What makes regions high-risk for wildfires?
Several factors contribute to how likely wildfires are to break out in any given area. The following factors put areas at risk:
- Dry climate
- Dense vegetation
- High winds
- Frequent lightning strikes
Long periods without rainfall can create terrain that burns more easily, while dense vegetation can provide lots of kindling for fires to start and spread. High winds can help a fire grow, turning what would have been a small incident into a major blaze and preventing containment. Lastly, lightning can be the catalyst that starts a wildfire; however, this is not the most common source. In fact, 84% of wildfires are caused by humans.
Mediterranean Europe, Australia, South Africa, and the Western United States include many high-risk areas. California, in particular, recently saw devastating wildfires in Southern California back in January 2025.
Climate change can increase this high risk. It has led to decreasing summer rainfall, earlier melting of winter snow, and hotter weather. Climate change enhances the drying of organic matter in forests and can even contribute to the spread of insects such as the mountain pine beetle, which can weaken and kill trees, leading to more potential kindling. Warmer nighttime temperatures, in particular, have had drastic consequences because they have allowed fires to persist over night.
Wildland-urban interface (WUI) fires
Wildfires are not only a problem in the wilderness, but can also affect human settlements. WUI (wildland urban interface) are places where human development meets or mixes with unoccupied wildland. In these areas, fires can burn down buildings and communities in addition to wildlife, increasing the dangers for those who live there.
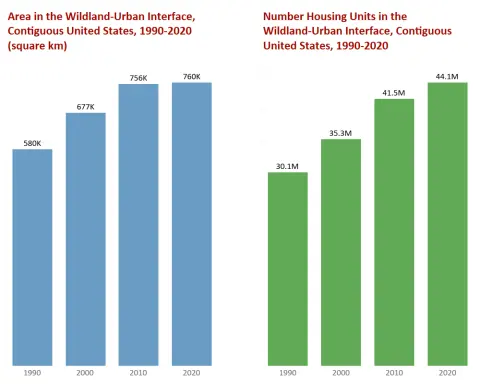
Within the United States, more than 60,000 communities are at risk for WUI fires, and these numbers are growing. The US WUI area continues to grow by about 2 million acres per year, with California having the most WUI areas.
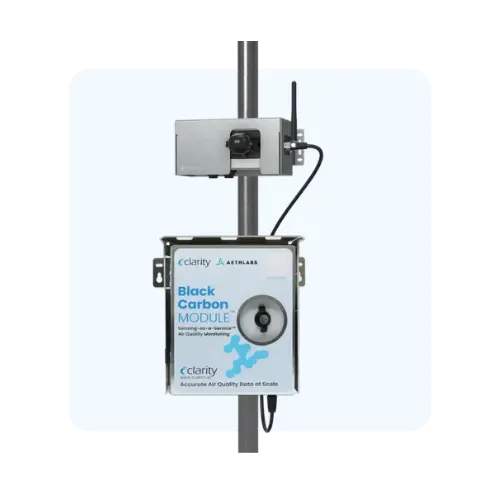
While all wildfire smoke degrades air quality, WUI fires produce more dangerous smoke fumes. Burning man-made structures and chemicals releases toxic pollutants into the air when compared to just burning vegetation. For instance, burning houses may release asbestos, volatile organic compounds, dioxins, furans, and even arsenic and lead.
With WUI areas increasing, these types of wildfires have become more common. Between 2002 and 2016 alone, over 3,000 structures per year on average were lost to WUI fires in the US. These types of fires will most likely increase as climate change intensifies and WUI areas continue to grow.
The past ten years of wildfire seasons in North America
United States wildfire trends
So, wildfires are becoming more common, but by how much? Over the last ten years, there has been variation in the number of fires in the United States and acres burned, with peaks in 2015, 2017, 2020, and 2024. Notably, the years of 2015, 2017, and 2020 had more acres burned than any other years recorded since 1980. Over ten million acres of land were burned in all three years, with 2024 coming in close with 8.9 million burned acres.
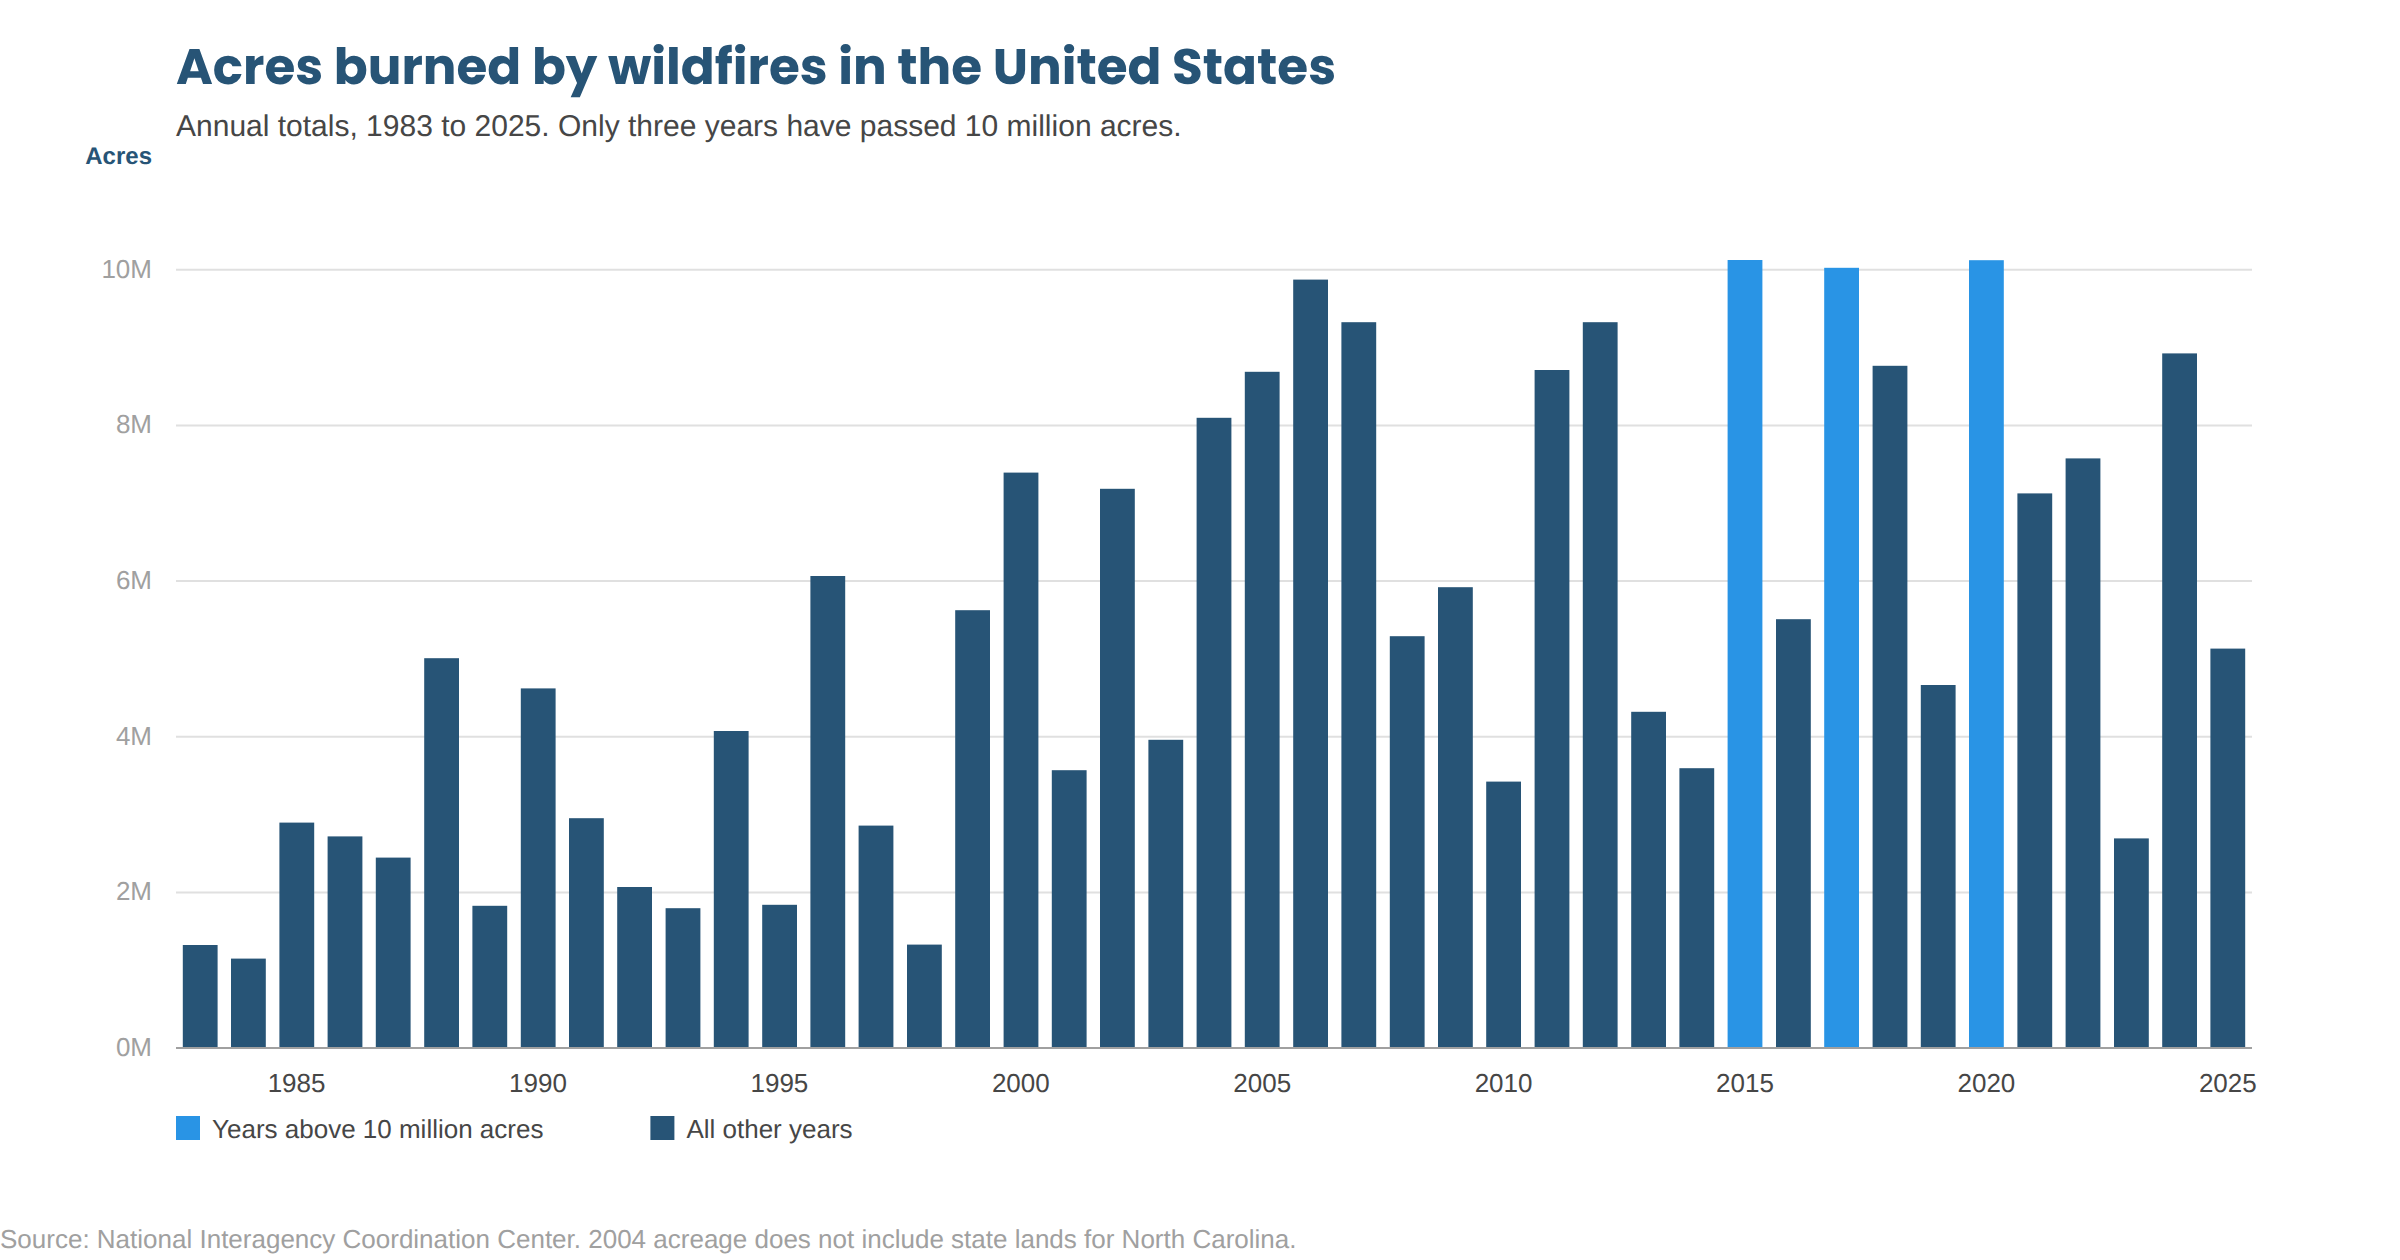
In the last ten years, only 2019 and 2023 saw less than five million acres burned. Forty years ago, five million acres would have stood out as particularly bad. Now, five million acres being burned in a year is particularly mild in comparison to more devastating recent years. Thus, wildfires are burning several million more acres of land each year as climate change intensifies.
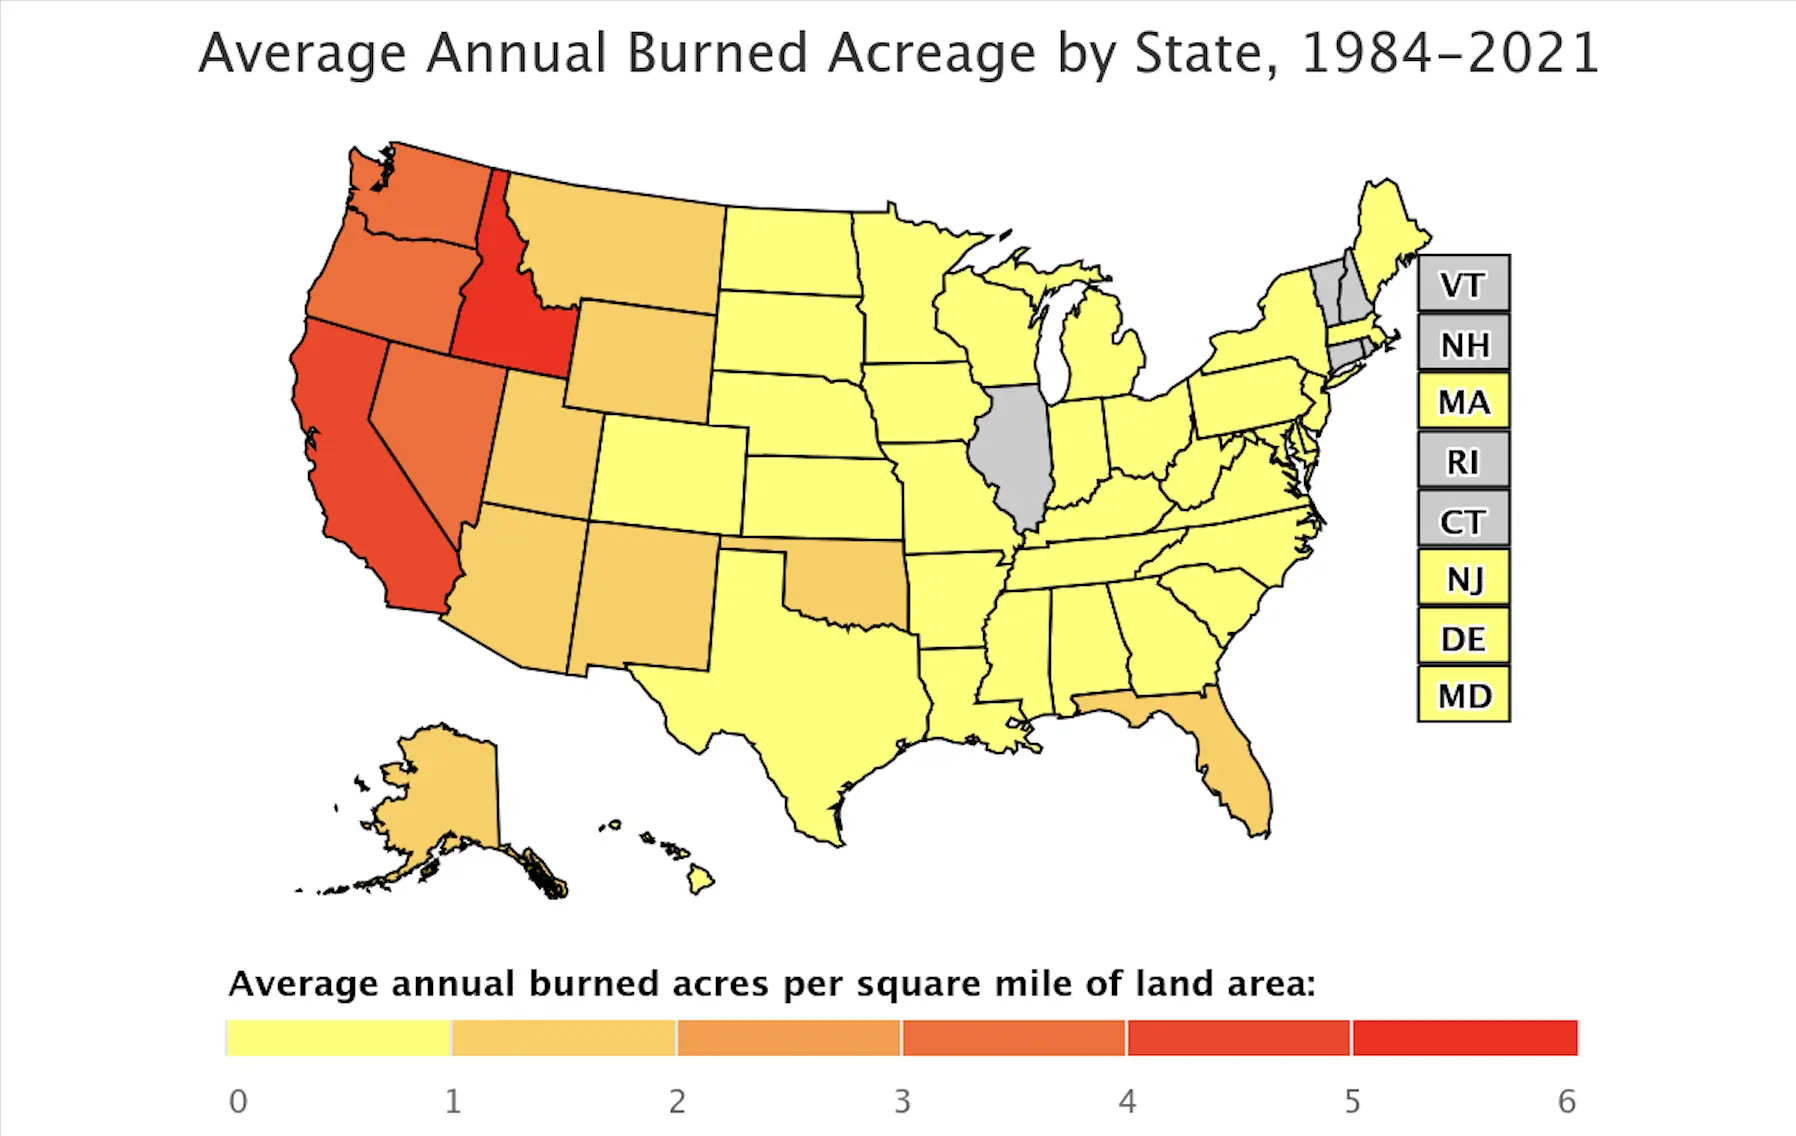
2025 broke the pattern in an unusual way. There were 77,850 wildfires, well above both the five-year and 10-year averages for fire counts, but they burned only 5,131,474 acres, more than two million acres below the 10-year average of 7.6 million. Alaska accounted for the largest share at roughly 1,006,000 acres.
2026 has been the opposite. As of 26 August, 51,295 wildfires had burned more than 7.9 million acres nationally, which is 165% of the 10-year average for acres burned and already more than the whole of 2025. The season has concentrated in the Pacific Northwest: the Big Grass Fire in Malheur County, Oregon, burned more than 578,000 acres before reaching 93% containment in late August, and the Sinlahekin Fire west of Tonasket, Washington, had burned more than 152,000 acres at 44% containment by mid-August. The country moved to Preparedness Level 5, the highest of five, on 18 July and has stayed there.
Canadian wildfire trends
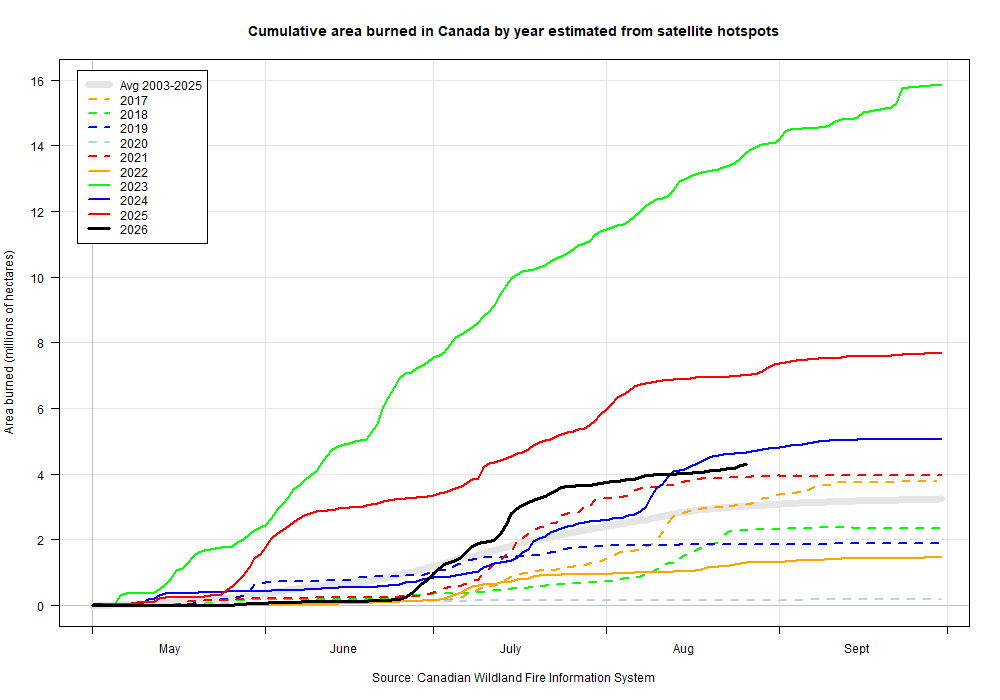
Canada has also experienced fluctuating fire seasons over the past decade, with record-breaking peaks occurring in more recent years. In particular, 2023 was a very intense fire season for Canada. Fueled by climate-change-induced drought and record-high temperatures, 2023's wildfires burned at least 15 million hectares of land, vastly outnumbering the 2.5 million hectares burned on average every year.
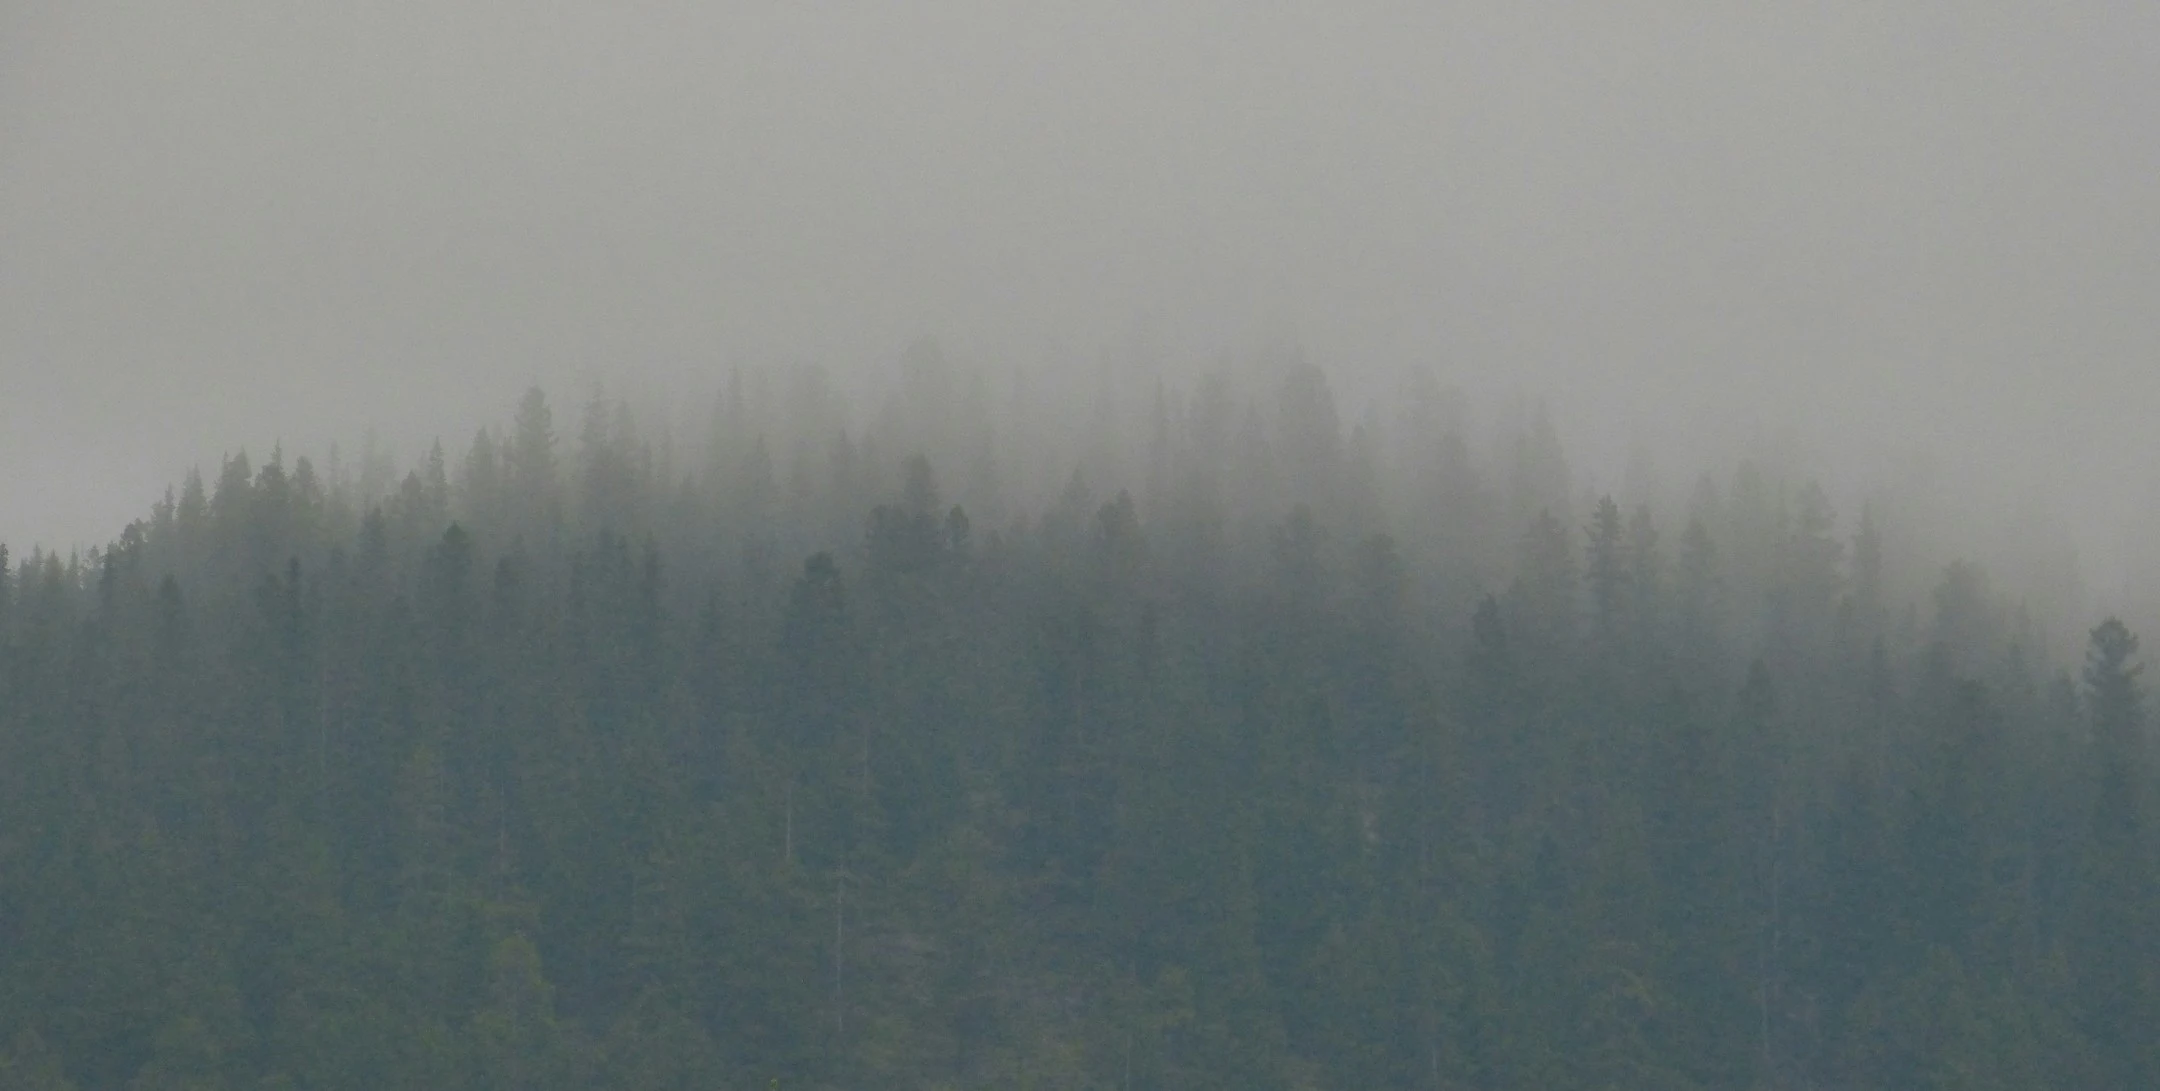
The extreme 2023 fires seemingly broke the limits of what was possible. The damage they dealt to ecosystems may take decades or even centuries to recover from, according to Professor Lori Daniels, of the Department of Forest and Conservation Sciences at the University of British Columbia. The thick smoke from the flames exposed millions to hazardous air pollution.
These devastating conditions may appear more frequently. Canada's 2024 fire season ranks among the worst, with roughly 5.3 million hectares burned. This number is greater than the yearly average, but fortunately still far from the conditions seen in 2023. 2025 was much worse. About 8.9 million hectares burned, passing the 1989 season and trailing only 2023, which makes it the second-worst year in Canadian records.
The 2026 season started slowly and then accelerated. By the government's 18 August update, 4,793 fires had burned 4.1 million hectares. That is more fires than at the same point in 2025, but across roughly half the area. British Columbia and Ontario have been hit hardest. Fires in northwestern Ontario in mid-July forced the evacuation of several First Nations communities, and heat and drought in southern British Columbia left more than 10,000 people under evacuation orders in early August. Smoke from those fires drifted south into the United States again, and we tracked those air quality impacts across our sensor networks in our breakdown of the Canadian wildfires and their reach across the US.
Although not every year brings the most severe fires, the trend is clear: devastating wildfires are becoming more frequent, threatening people and wildlife in the United States, Canada, and around the world.
How can we prevent wildfires?
Community or government-based measures, such as controlled burns and firebreaks, can alter terrain to stop wildfires from growing and spreading in high-risk areas. To protect your property, you can install fire-resistant roofing and building materials as well as alter the surrounding vegetation to prevent fire from spreading to your building or home.
Even with these measures, no house is completely fireproof. In order to properly address and reduce these fires, we must first address and mitigate climate change. Reducing greenhouse gas emissions is the best way to protect both people and the planet.
Looking forward
As wildfires grow more frequent, understanding their impact on air quality is increasingly important. Partnering with Clarity Movement can help you monitor the threat of wildfire smoke and respond effectively.