
How wildfire smoke calibrations improved PM2.5 measurement in California
TL;DR - Clarity’s air quality sensing-as-a-service solution uses cloud analytics to calibrate PM2.5 data from each of its monitors for air quality events like wildfire smoke. After applying our correction for wildfire smoke in California, our calibrated air quality monitors were twice as accurate as uncalibrated low-cost sensors when assigning air quality to the appropriate AQI category.
The state of California has been challenged to adapt to wildfires that arrive with more intensity and regularity each year, forcing evacuations and threatening public health across the state with unhealthy levels of air pollution. One area where the need for a new approach has become exceedingly clear is in the field of air quality monitoring.
Air quality management authorities traditionally rely on air quality reference monitoring stations to provide citizens with information about the air we are breathing. In California there are only around 250 reference stations, meaning that on average, there is less than one station for every 600 square miles in the state. These reference stations have significant spatial and temporal blind spots due to the limited measurement points, which makes it difficult to produce the type of actionable, local air quality data needed to protect public health during major air pollution events.
On the other end of the spectrum, networks of low-cost air quality sensors, often installed by citizens near their homes, have gained popularity in recent years to provide a more granular picture of local trends in air quality. But these types of monitors are known to under- or over-estimate pollutant levels compared to the more accurate (but sparsely populated) reference monitoring stations, especially during highly localized extreme pollution events like wildfires. This is why it can be difficult to know which data sources to trust for the most current and local air quality data.
Indicative air quality monitoring solutions like Clarity's can be used to obtain a local, real-time, and accurate picture of air quality, so long as they are adjusted to local conditions through a process known as calibration.
How air quality data calibration works
Calibrations are performed through a colocation, where an indicative air quality monitoring sensor is placed next to a reference station. Over a period of time, this provides a large dataset that serves as the basis for a correction to adjust the readings from the indicative sensor to better align with reference station readings. This process improves accuracy and allows for use of absolute readings from indicative sensors rather than only relative readings.
Calibration is especially important during wildfires and other major air quality events. The only way to improve the accuracy of indicative air quality sensors to ensure usable data during these events is with a calibration designed specifically for measuring fine particulate matter from wildfire smoke.
However, when you have air quality sensors in the field and need to apply a correction during major air pollution events like a wildfire, it is not expedient to initiate a new colocation study. Fortunately, the Clarity network already had 30 sensors colocated with reference monitors across California when the wildfires started in mid-August.
Leveraging our network of existing co-located sensors, Clarity recently adjusted the calibration algorithms we use across California to ensure accurate data in the face of the fires burning across the state.
Given the need for accurate and reliable data, we quickly built a wildfire correction for PM2.5 from these colocated sensors and applied this adjustment to monitors across California. Using hourly data from July 7 to Aug 20, 2020, from these colocated monitors, we developed a 10-fold cross-validated multiple linear regression model:
[calibrated PM2.5 mass concentration] = 0.596 * [raw PM2.5 mass concentration] - 0.045*Relative Humidity + 3.819 ug/m3
Our calibration technique incorporates PM2.5 data from a range of sources, including readings from both Clarity sensors and government reference stations. This allows us to quickly apply corrections across specific sensors or regions in a nimble way. The raw data from our calibrations are preserved for reference and future analysis.
Several papers have been published on corrections from air quality measurements during previous wildfire smoke events (1,2,3), and this model is consistent with those studies. After verifying accuracy improvements, we applied this correction to Clarity air quality monitors across California, including those on our OpenMap.
OpenMap uses the EPA’s NowCast methodology to calculate the Air Quality Index (AQI). The AQI shows the air quality in an easy-to-understand color scale that explains the risk to certain populations and provides guidance on acceptable exposure. The Nowcast AQI shown on OpenMap is the current hour’s AQI calculated using a range of data in the past.
Clarity’s cloud-enabled air quality monitoring solution also supports individual corrections for each Clarity Node, rather than employing a blanket correction for all of the monitors across a region as commonly seen with low-cost solutions. This allows us to apply the wildfire-specific correction only where there are wildfires and not globally.
Air quality data calibration results
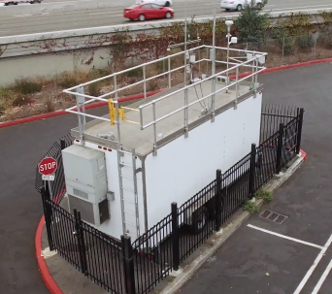
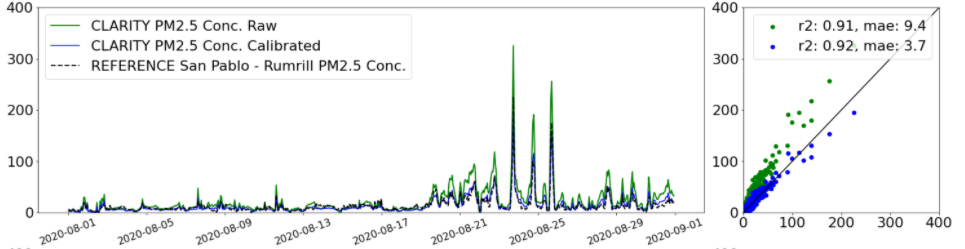
To demonstrate the impact of our calibration technique on accuracy, we compared the pre- and post-calibration readings from a Clarity Node located in San Pablo, CA.
The recent California wildfires began on August 18th. Over the period between Aug 18th to Aug 31st, Clarity’s calibrated monitor was able to assign air quality to the correct AQI category for 80% of the reported hourly averages, versus 41% for the same sensor without calibration.
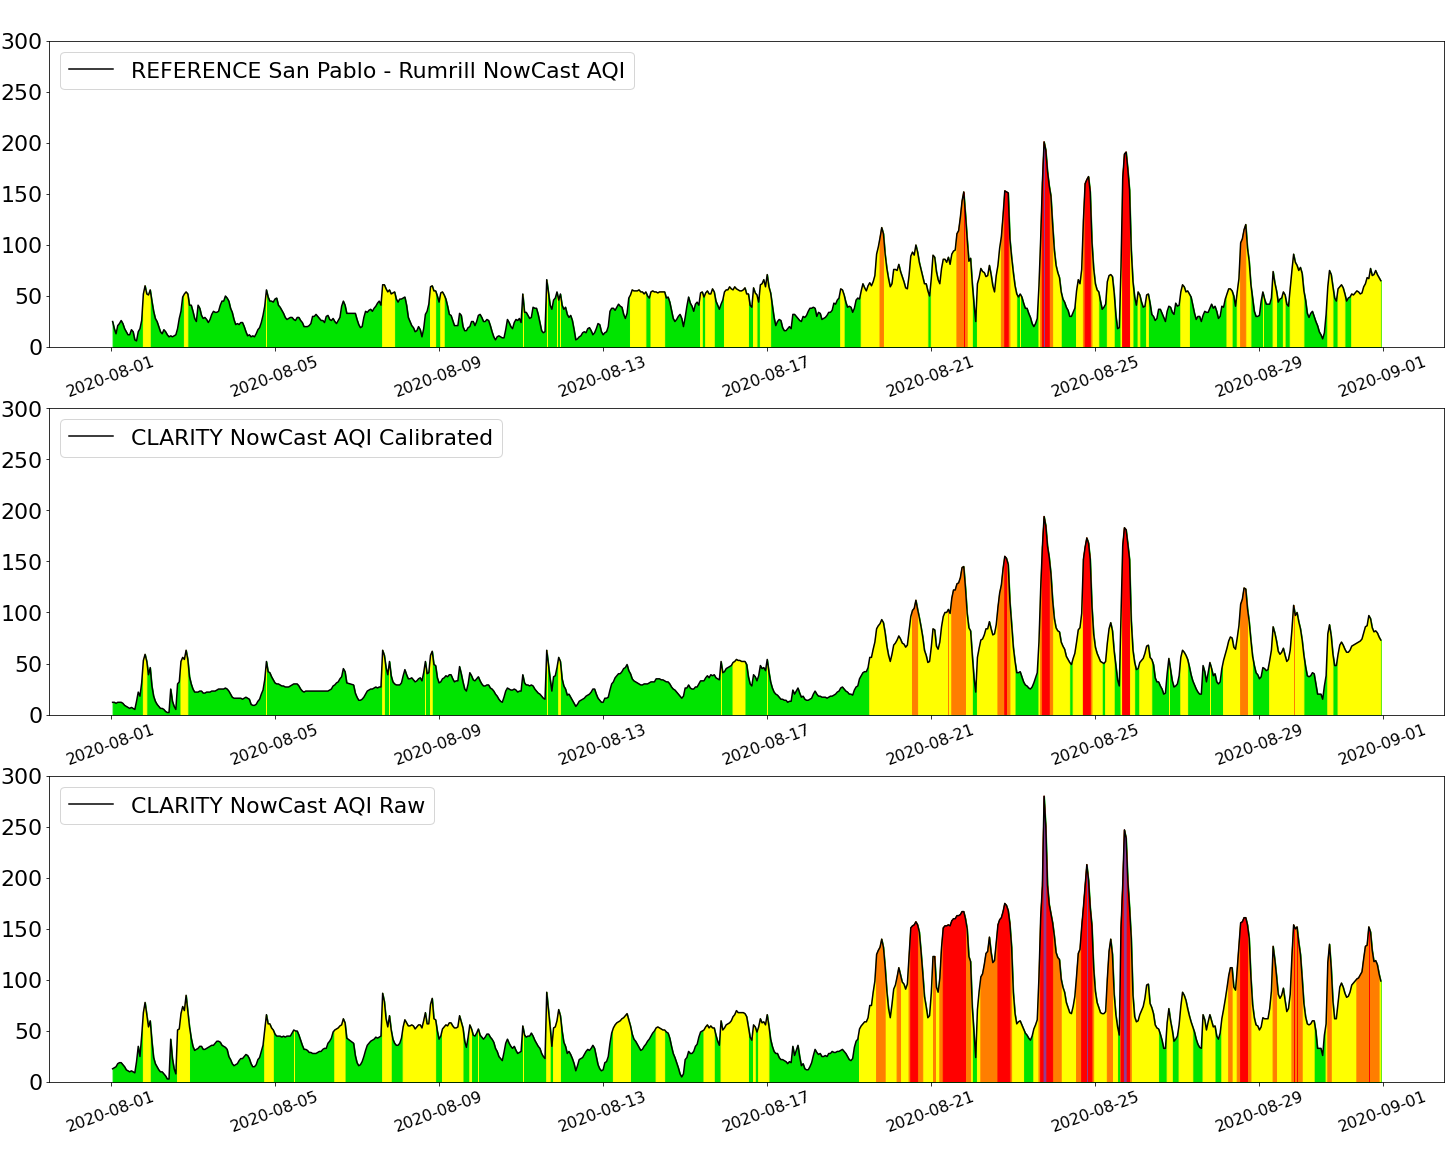
The calibrated monitor performed far better than the uncalibrated monitor during the wildfire smoke event beginning on August 18th. The uncalibrated monitor overestimated the AQI category for 59% of the reported hourly averages and was more than 4 times more likely to overestimate the AQI category than the calibrated monitor.
Accurate air quality data is crucial when communities and businesses rely on readings from sensors to make real-time operational decisions. Cities and businesses that use this data to keep their residents and employees safe and comply with safety protocols such as Cal/OSHA emergency regulation section 5141.1 cannot afford to rely on sensors that frequently over- or under-estimate AQI.
In the coming weeks, we’ll monitor how the calibrated data perform and continue to update our model to provide accurate, local air quality data for California as it battles this latest round of wildfires. In the meantime, we would like to send our deepest gratitude to the firefighters and emergency personnel that are working overtime to protect the homes, lives, and lungs of millions of Americans from wildfires and the noxious smoke they generate.
1. https://www.tandfonline.com/doi/full/10.1080/10962247.2019.1654036
2. https://www.ncbi.nlm.nih.gov/pmc/articles/PMC9784900/
3. https://www.tandfonline.com/doi/full/10.1080/02786826.2019.1623863