
TL;DR - While certain air pollutants are monitored more commonly than others, it is important to recognize that air pollution is a dynamic phenomenon, and any measurement we derive provides only a snapshot for one pollutant at a given point in time. Creating denser, higher-resolution monitoring networks for "proxy pollutants" such as particulate matter and nitrogen dioxide helps us estimate the overall level of pollution in the air, but to truly understand the air pollution dynamics taking place in a given area it is important to measure a range of pollutants. By obtaining measurements for a variety of pollutants — and pairing these "snapshots" with our understanding of the chemical reactions that drive air pollution dynamics — we can begin to paint a much more complete picture of how air pollution plays out in that region and what preventative actions should be taken to minimize exposure.
Air pollutant classification
The variety and complexity of air pollutants means that they can be classified in a variety of ways — such as their physical composition, their sources, their health impacts, and how they are regulated (if at all).
The USEPA, for example, broadly classifies pollutants into two categories: Common Air Pollutants and Hazardous Air Pollutants. Common Air Pollutants are the six that are regulated by the National Ambient Air Quality Standards — particulate matter, ground-level ozone, carbon monoxide, sulfur dioxide, nitrogen dioxide, and lead. Hazardous Air Pollutants (HAP), also known as toxic air pollutants, are those that are known or suspected to cause serious health effects (including cancer, reproductive effects, or birth defects) or adverse environmental effects — these include benzene, dioxins, asbestos, toluene, and metals such as cadmium, mercury, chromium, and lead compounds. HAPs are regulated in the US through amendments to the Clean Air Act.
As demonstrated by the graphic below, another way of classifying air pollutants is related to their physical composition — are they composed of solid, physical matter, or are they gaseous?

The dynamic nature of air quality
Local and regional air quality are highly dynamic, complex systems that can change rapidly based on interactions between different pollutants, wind, and other climatic factors.
Particulate matter (PM) is the most commonly monitored air pollutant, with over 30K global measurement points reported by air quality databases like OpenAQ and the World Air Quality Index. This number is growing rapidly with the advent of more reliable, affordable, and scalable air quality sensors.
While measuring PM at high-resolution allows us to answer the question of "is air pollution present?", introducing additional instrumentation to measure other pollutants allows us to answer a much wider range of questions such as:
- "What specific sources are causing this air pollution?"
- "How do wind, photochemical reactions, and other climatic factors influence the development of air pollution in this area?"
- "How do different air pollutants contribute to health impacts in this area?"
- And most importantly, "How can we most effectively minimize the negative impacts of air pollution in this area?"
Air pollution interactions and secondary pollutants
Though primary air pollutants can have highly detrimental effects, they do not exist in a vacuum. Secondary air pollutants, which form as a result of reactions between primary pollutants in the atmosphere, also play a role in the overall picture of air quality.
One major secondary air pollutant, ground-level ozone, forms due to interactions that occur when two primary pollutants, volatile organic compounds (VOCs) and nitrous oxides (NOx), react with sunlight in the presence of heat. These primary pollutants can be transported long distances by wind, meaning that even rural areas with fewer emissions of these primary pollutants can still experience high levels of ozone.
Ground-level ozone is connected to significant damage to both human and environmental health. To learn more about this air pollutant, read our blog covering ground-level ozone.
Photochemical smog also results from interactions between different air pollutants. This smog has a brown haze and can be painful to the eyes, accounting for most of the smog we see today. Photochemical smog forms from interactions between particulates, nitrogen oxides, ozone, and other air pollutants, though primarily from VOCs and NOx since ozone comprises a large portion of this smog. Peroxyacetyl nitrate, known as PAN, is another component of photochemical smog that can cause eye irritation and respiratory issues.
Smog is most likely to become an issue in big cities with a lot of industry and traffic, especially those that are situated in basins — such as Los Angeles and Mexico City — because the landscape can trap the smog and prevent it from being dispersed by the wind.
Air pollutant interactions can also contribute to the formation of acid rain. Specifically, interactions between nitrogen dioxide, sulfur dioxide, water, oxygen, and other chemicals in the atmosphere form acidic compounds. When they fall to the ground in the form of acid rain, they can irritate the airway and eyes as well as cause the superficial decay of monuments, statues, and other important cultural structures.
To provide some real-world examples of why it is important to tailor air monitoring equipment to the specific needs of a given region, we have highlighted three world cities and the unique air quality issues each city faces.
Ozone Case Study: Los Angeles
Los Angeles' air pollution is some of the worst in the United States for fine particulate matter (PM2.5) and ground-level ozone. In fact, according to the 2019 World Air Quality Report, Los Angeles county contains nine of the fifteen most polluted cities in the United States when it comes to PM2.5. In the 2019 State of the Air Report, the Los Angeles metropolitan area had the worst ground-level ozone pollution in the country.
The city's large population is one contributing factor to high air pollution. There are an estimated 4 million people in the city alone, with another 5 million in the surrounding Los Angeles County. An estimated 6.5 million vehicles are active on LA's roads and highways, creating a significant amount of vehicle emissions that contribute to air pollution.
The Los Angeles area also includes the Port of Los Angeles and the Port of Long Beach, two of the busiest container ports in the United States. Ports often rely on fossil fuels and diesel to power ships, trucks, and other vehicles, and these two produce an estimated 100 tons of smog daily.
These two ports are known to be one of the largest single sources of emissions in the region. Ships, using the cheapest form of diesel fuel, account for 59% of diesel particulate matter, 36% of NOx, and 90% of SOx emissions associated with the ports. Heavy-duty vehicles account for 10% of diesel PM, 36% of NOx, and 1% of SOx port emissions.
Wildfires are also prevalent in the LA region, and affect air quality both during wildfire season as well as year-round.
Though Los Angeles' large population and transportation factors contribute to air pollution, the city also experiences specific climatic conditions that create a less-than-ideal environment for air quality. The city is situated in a basin where pollutants, such as ground-level ozone, can get stuck, preventing them from dispersing from their original location.

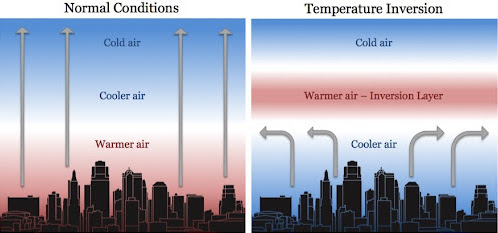
Temperature inversions occur in the area during the summer when warmer inland air traps the cooler ocean air closer to the earth's surface, preventing the polluted air from dispersing from the area — specifically, this is referred to as a marine inversion. These sinking inversions can occur in the Los Angeles area, where the bordering cold waters of the Pacific Ocean can make it harder for air pollution to disperse. These types of inversions can also occur in many areas of the world, including the Bay Area, and affect air pollution.
Even within the basin, air pollution can differ widely. Due to prevailing wind patterns, secondary pollutants like ozone are reported to reach concentrations of 250 ppb in areas over 50 kilometers downwind in the western portion of the basin. This trend is not unlike patterns seen in other cities — for example, London also has a history of having worse air quality to the East due to prevailing Westerlies wind pattern in the northern hemisphere — exemplifying the complex, dynamic air quality systems that exist in many locations.
Because of the unique air quality conditions in Los Angeles, ground-level ozone often exists at high concentrations. Ozone is formed through photochemical reactions in the presence of heat, and the high temperatures of this region speed up these photochemical reactions. Increasingly high temperatures in Los Angeles — with August 2020 being the hottest month on record in California, and temperatures exceeding 120F in LA for the first time in September 2020 — only worsen this problem.
The city is also known for having high particulate matter pollution, being ranked fourth for particle pollution in a recent report from the American Lung Association.
This high level of air pollution — particularly of ground-level ozone and particulate matter — is responsible for vast health impacts. Poor air quality damages the lungs' airways, and research shows it also reduces the respiratory system's ability to fight infection and remove foreign particles. Ozone exposure can pose a particular threat to those with existing respiratory conditions, like asthma, chronic bronchitis, and COPD — a category which comprises 10% of the 14 million people living in the South Coast basin.
In order to combat this air pollution, South Coast Air Quality Monitoring District (SCAQMD) continuously monitors air quality at 38 different locations, monitoring many, but not all, air pollutants.
Particulate Matter Case Study: Bengaluru
Bengaluru (sometimes also referred to as Bangalore) is the capital city in the state of Karnataka, India, and the third most populous city in India. Known as the IT capital of India, the city's population has grown to approximately 12 million people, with over 8 million vehicles.
The city often experiences poor air quality, particularly tied to the high level of particulate matter air pollution.
Bengaluru is similar to other large cities in India in that much of the air pollution comes from vehicles and road transport. As vehicles drive on the road, they can stir up soot and fine particulate matter. Diesel is also still used for many vehicles, which emits more pollution than other types of cleaner fuel.
A general reliance on fossil fuels in the transportation sector in Bengaluru continues its poor air quality. Although the city has public transportation infrastructure, it cannot keep up with the growing city's demand, thus leading to an increase in the use of private vehicles.
The use of both diesel and outdated motor vehicle engines lead to the formation of black carbon (BC), a major component of soot. Black carbon is more toxic to human health than other forms of particulate matter, and can react with other air pollutants, such as nitrogen dioxide, sulfur dioxide, and ozone to create harmful secondary pollutants.
Construction is also a major source of pollution in the growing city. Construction activities can stir up and emit fine metal particles, plastics, and other substances that contribute to high fine particulate matter (PM2.5) levels.
With Bengaluru's large population, the larger demand for resources also means a larger demand on the environment. According to a report from Greenpeace India, increased economic activity is still largely linked to toxic air pollution.

Overall, transport is the key emission source for Bengaluru - vehicle exhaust and on-road dust resuspension account for a combined 56% and 70% of total PM 2.5 and PM 10 emissions; followed by industries (17.8% including the brick kilns), open waste burning (11.0%), and domestic cooking, heating, and lighting (6.5%), in case of PM 2.5" — Guttikunda et al. 2019
Though the city is known to have high levels of particulate matter pollution, we don't know what portion of this PM is composed of extremely harmful black carbon because there is limited air monitoring infrastructure. The fact that the majority of PM pollution in the region comes from transport allows us to theorize that BC is a major component of PM pollution in the region, but until more BC monitoring instrumentation is deployed we will not have measurements to support that theory.
Air quality monitoring in Bengaluru is undertaken by Karnataka State Pollution Control Board (KSPCB), a governmental body in charge of air pollution. As of 2018, 24 air monitoring stations were present in Bengaluru. The organization gives monthly, rather than daily, updates on air quality, though their data is not accessible to the public. These monitors tend to be installed higher above ground than would be appropriate to measure ground-level exposure, putting into question how well they represent actual pollution levels on the ground.
Additionally, because of the size of Indian cities and the country as a whole, using higher cost equipment is not economically viable, so using a combination of low-cost sensors and reference-grade monitors can allow for a more holistic picture of air quality.
To learn more about the low-cost sensor network we helped to establish in Bengaluru, check out our customer story here.
Nitrogen Dioxide Case Study: London
Air pollution also poses a significant issue in London. Like Los Angeles, London's geography can cause periods of intense air pollution. While there are no mountains near London, it is surrounded by hills forming an air basin that collects air pollutants — similarly to the Los Angeles air basin — particularly when wind flow is low and temperature inversions occur.
According to a study by King's College, air pollution contributes to more than 9,000 premature deaths each year in the city. In December 2020, a London coroner made legal history by ruling that air pollution was the cause of the death of a nine-year-old girl — finding that a failure to reduce pollution levels to legal limits, as well as a failure to provide her mother with information about the potential for air pollution to exacerbate asthma, contributed to her death. This was the first time that air pollution was found to be a legal cause of death in the UK, and this tragic story added even more urgency to the campaign to solve London's longstanding air pollution issues.
Nitrogen dioxide (NO2) is a major air pollutant of concern in London. Nitrous oxides (NOx) — made up of both NO2 and NO molecules — are produced by combustion sources. While it is nitrogen dioxide that is responsible for most detrimental health effects, NOx easily converts to NO2, so monitoring both pollutants can be helpful in controlling overall air quality.
A majority of London's air pollution stems from road transport — particularly cars, buses, and taxis, as well as vehicles that use diesel. Traffic congestion, like slow-moving buses and private vehicles, contribute to high levels of NO2 pollution in certain parts of the city. Although the actual number of vehicles has decreased due to a vehicle tax meant to deter congestion, the number of private hire vehicles has quadrupled since the tax was introduced, as these vehicles can still enter the city center exempt from charge. The medieval road design of narrow streets also contributes to start-stop traffic and increases congestion.

The high levels of air pollution in London are responsible for significant public health impacts. According to a report from London Councils, 9,400 premature deaths and a cost of £1.4 and £3.7 billion a year are attributed to air pollution exposure.
Poor air quality also affects health in the long-term, contributing to more respiratory illnesses like asthma and lung cancer and stunted growth of children's lungs, among other effects. In London, one-third of schools are near busy roads with levels of NO2 pollution that exceed legal limits, creating a cause for concern.
London has the densest and most advanced regulatory monitoring network in Europe with over 140 regulatory-grade automatic stations monitoring NO2 and/or PM10. However, the city still felt that they needed more granularity in their monitoring network, prompting them to invest in the Breathe London network.
This high-density network of Clarity Node-S air sensors functions alongside the London Air Quality Network (LAQN) to provide air quality data of higher spatiotemporal resolution and improve data access for the citizens of London. There are currently more than 350 Node-S air sensors installed across London, with that number expected to grow as the programs expand and more communities get involved through the Breathe London Community Programme.
The city has also instituted an Ultra Low Emission Zone (ULEZ) — mandating that vehicles that don't meet greenhouse gas emission standards must pay a fee to drive into the ULEZ, a zone that covers central London, in an attempt to further lower NO2 pollution levels.
The future of London's air quality looks more optimistic — since Sadiq Khan became mayor in 2016, there has been a 94% decrease in the number of people living in areas with illegal levels of NO2 pollution. A report from the Mayor of London's office also showed that the number of people living with polluted air fell from 2 million in 2016 to 119,000 in 2019. These results demonstrate the impact that data-driven policies targeting specific pollutants — such as the traffic-related policies targeting NO2 in London — can have on public health.
Customize your air quality monitoring equipment for a holistic understanding of air quality
Air quality is a complex and highly dynamic phenomenon, where measurements of any one air pollutant provide a snapshot of air pollution at a given time, but lack the context to paint a complete picture of air pollution.
Measuring more air pollutants, such as ground-level ozone, black carbon as a component of particulate matter, and nitrogen dioxide, aid in filling in the gaps that exist when only a proxy pollutant such as particulate matter is measured. Understanding that these pollutants do not exist alone but interact with each other in complex ways is also key to painting a more holistic picture of how air quality plays out in a given location — and coming up with creative solutions to minimize the negative effects of air pollution.
In addition to our flagship PM and NO2 sensor, the Clarity Node-S, Clarity offers a range of Modules that allow you to measure a wide range of pollutants with a Clarity network. Clarity Modules integrate directly with the Node-S for seamless integration with our suite of software and service offerings.
If you're interested in learning how you can use Clarity Modules to design a custom air monitoring network tailored to the pollutants prevalent in your region, don't hesitate to request a quote for a custom air monitoring network or get in touch with one of our Air Quality Experts.