
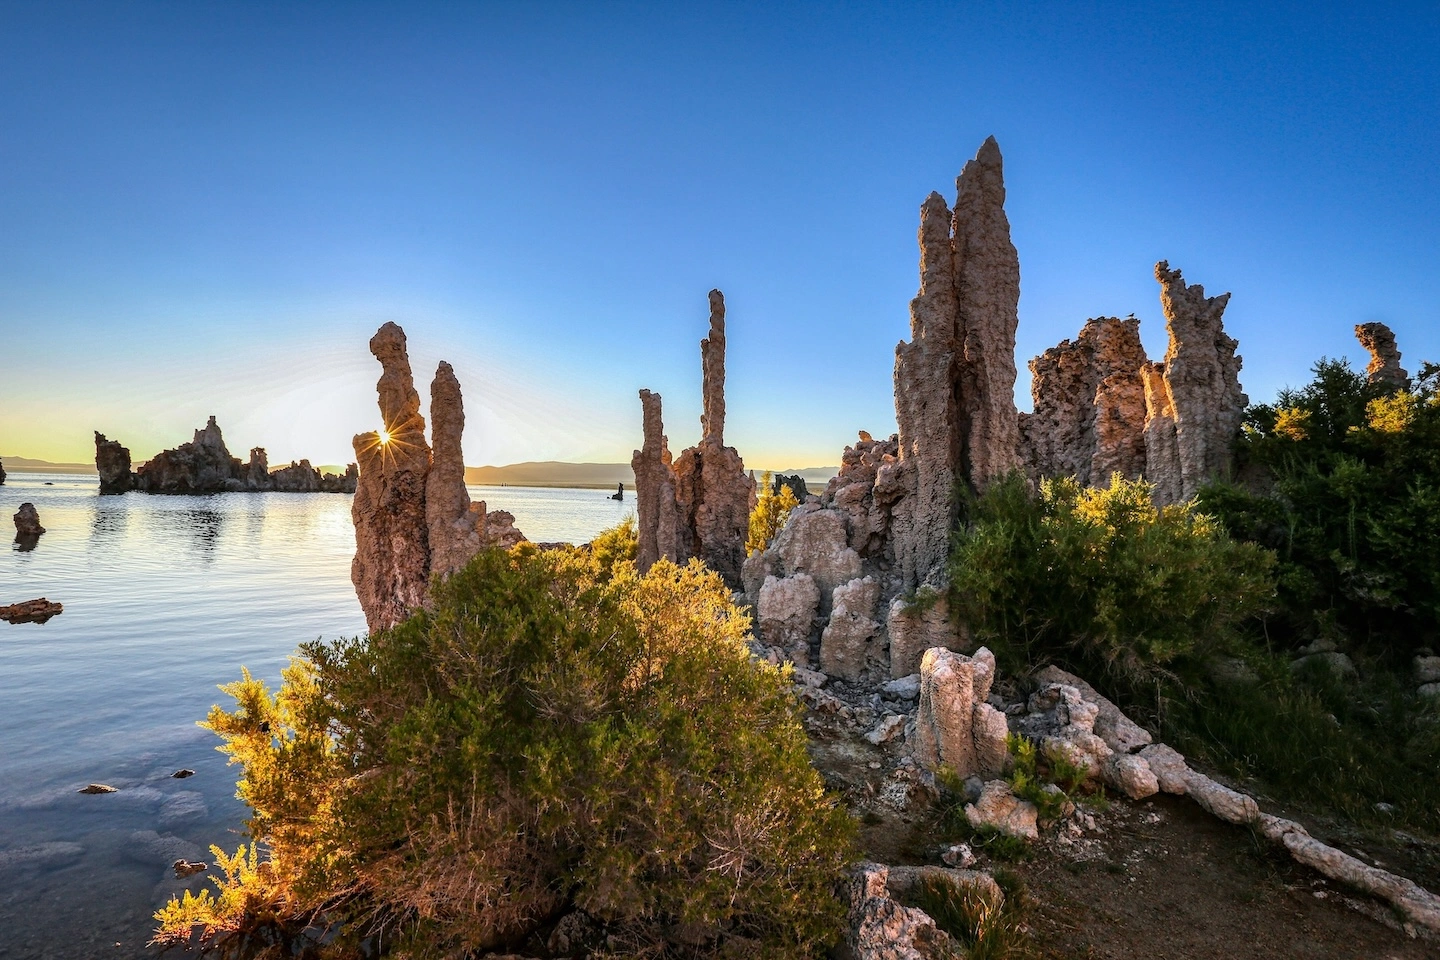
Image provided by Grégoire Thibaud via Unsplash.
TL;DR: Mono Lake is the largest active source of human-caused dust air pollution in the United States, a result of decades of water diversions that have lowered lake levels and exposed the emissive lakebed. High winds regularly lift the exposed lakebed sediment, driving frequent exceedances of the PM10 air quality standards. These conditions threaten the lake’s ecosystem and can even spread dust to nearby communities.
Located in Eastern California, between Yosemite National Park and the Nevada border, Mono Lake is currently the largest active source of anthropogenic (human-caused) dust pollution in the United States. Clarity Movement’s Hardware Development Engineer, Ken McGary, recently visited this lake, where he conducted research into this site’s unique air pollution and history.
An overview of Mono Lake
Mono Lake is one of the oldest lakes in North America, at over 1 million years old. Over this time span, minerals and salts have washed into the lake from surrounding streams. Since the lake has no natural outlet, these minerals stay in the water. The result is that the lake is now two and a half times as salty as seawater and very alkaline, with a pH of about 10.
These conditions are too salty even for fish; however, brine shrimp and alkali flies thrive in the salty waters. Each year, about 1-2 million birds feed and rest at Mono Lake, where they feed on the shrimp and flies. This ecosystem is a vital wildlife habitat. When Mono Lake is threatened, the many species that rely on it are threatened too.
Mono Lake history
Since the 1940s, the City of Los Angeles has been diverting water from the creeks that naturally flow into Mono Lake, redirecting the water over 300 miles into the city’s water supply. Unfortunately, this leaves Mono Lake with much less water than it should have.
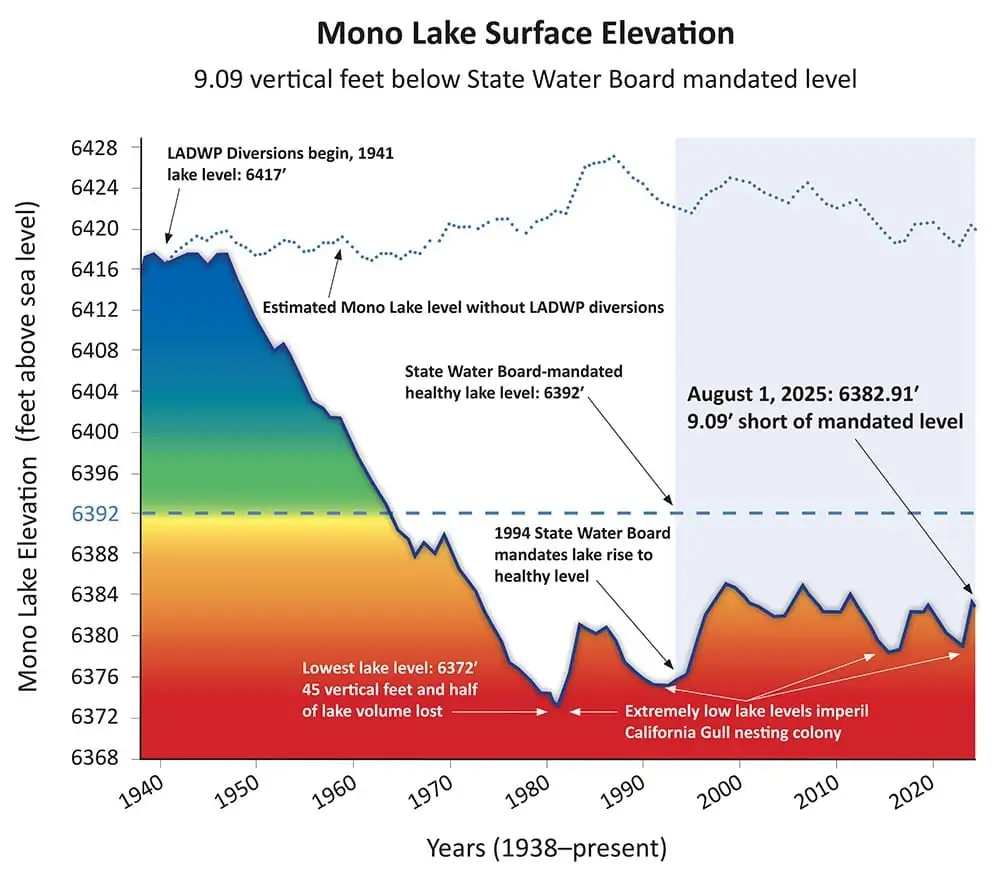
The lower lake levels have real consequences for the wildlife that live there. For instance, the local California gulls have been suffering from nesting failure and major population decline. In 1994, the state water board ruled that it would limit the amount of water being diverted from the lake, setting a target lake level of 6,392 feet above sea level. Unfortunately, Mono Lake still remains about 9 feet short of this mandated level.
Notably, management changes, environmental justice groups, and restoration efforts have prevented the Lake’s levels from falling far lower than they have now. Yet, more needs to be done to protect this lake and its ecosystems in the future.
Mono Basin PM10 air pollution
Lower lake levels not only harm wildlife, but they also harm air quality and public health by causing coarse particulate matter (PM10) air pollution. Particulate matter refers to any liquid or solid particles suspended in the air. PM10 refers to particulate matter with a diameter of 10 micrometers or smaller, and it is also known as dust.
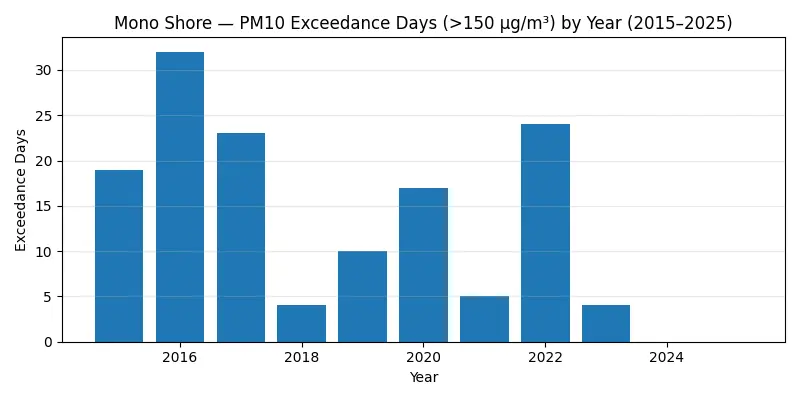
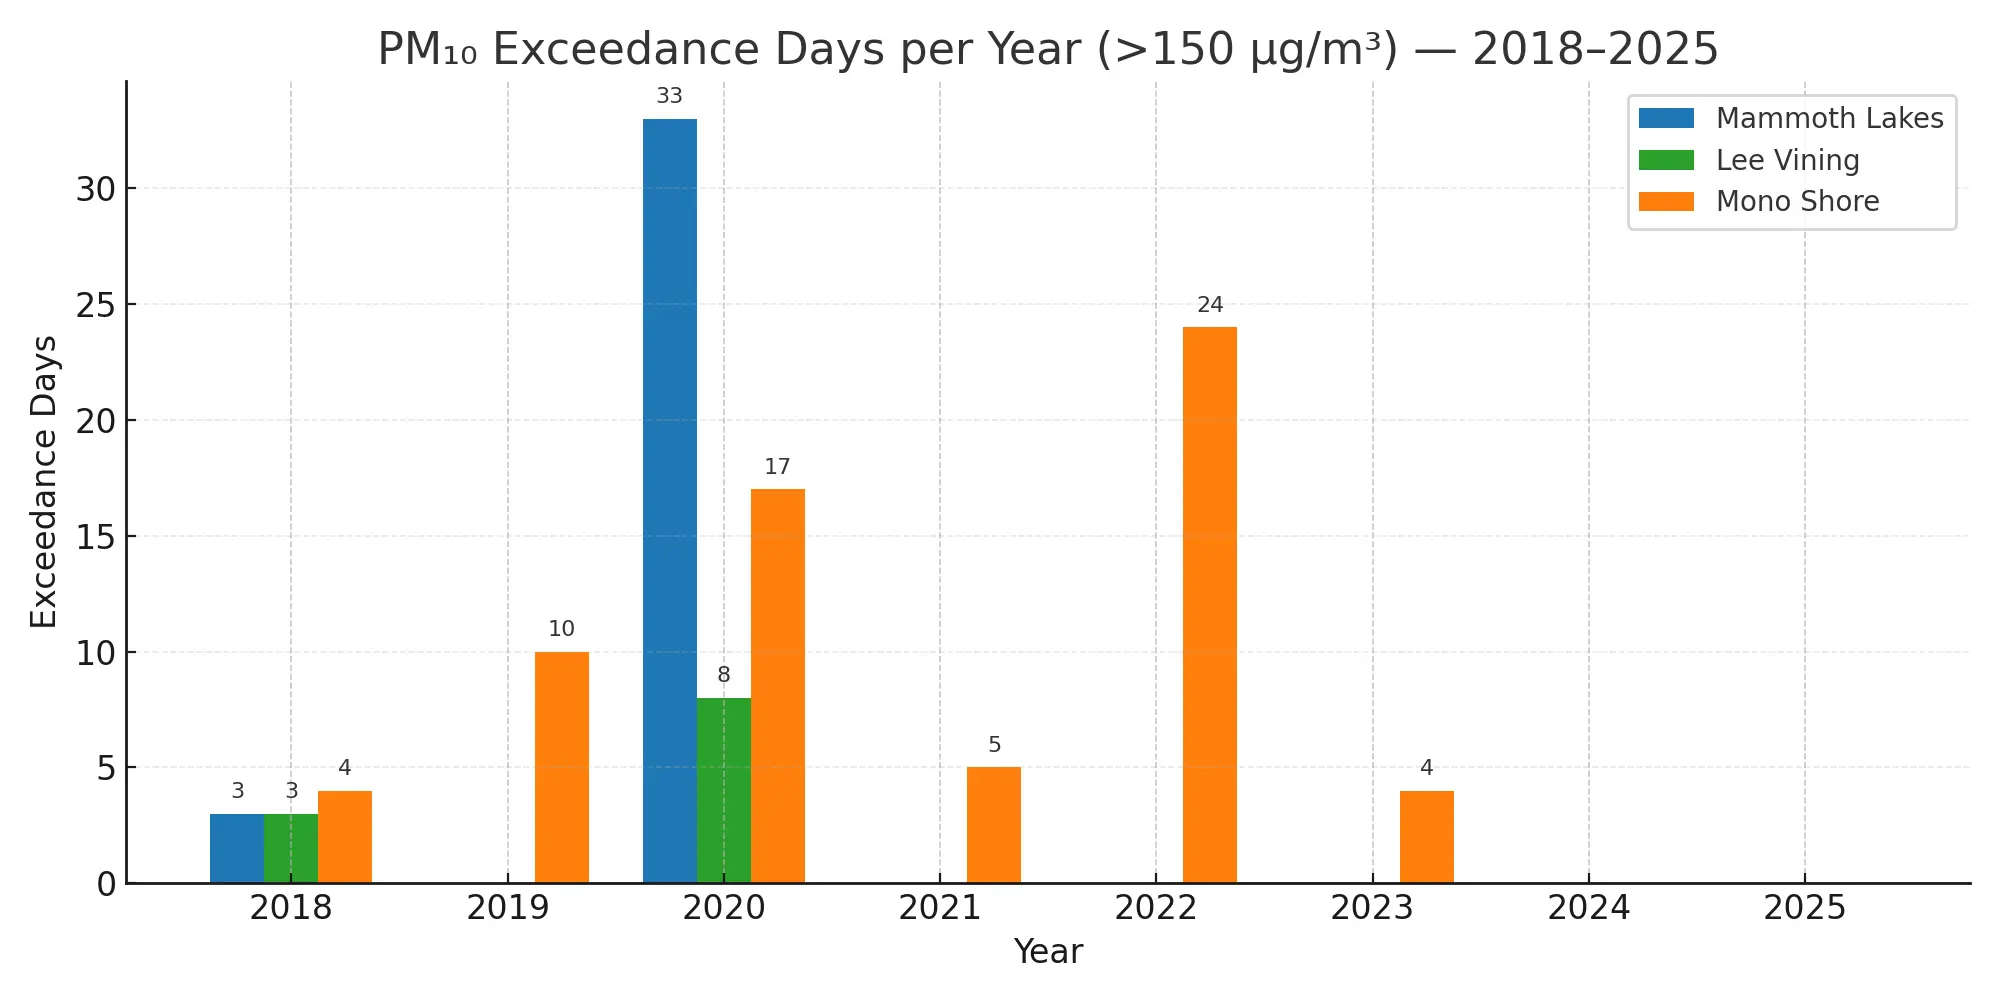
The National Ambient Air Quality Standards (NAAQS) 24-hour average limit for PM10 air pollution is 150 µg/m³. This should not be exceeded more than once per year on average over 3 years. Unfortunately, Mono Lake often sees far more frequent exceedances.

High winds, a regular feature of the local climate, kick up the dry lakebed left behind by Mono Lake’s receding waters, resulting in some of the worst dust air pollution in the nation. Mono Lake’s current elevation exposes roughly 75 acres of emissive lakebed. The best way to reduce this source of air pollution is to raise Mono Lake’s waters back to a healthy level.
Another source of PM10 air pollution in this area comes from wildfire ash. Recent wildfires such as the 2020 Creek Fire and the 2018 Ferguson Fire resulted in spikes of PM10 emissions measured in the area. Wildfires also produce many other air pollutants, which can affect local air quality.
The effects of PM10 air pollution at the Mono Basin
PM10 air pollution does more than just decrease visibility. These particles are small enough to be inhaled. When breathed in, this type of dust can worsen respiratory diseases such as asthma, reduce lung function, increase the number of hospitalizations and emergency department visits, and sometimes even lead to reduced life expectancy. Children, older adults, and individuals with preexisting conditions tend to be the most vulnerable.

PM10 emissions at the Mono Basin can spread via wind to surrounding communities. Although there are a few population centers directly downwind of the lake, some dust from the Mono Basin can spread very far when winds are high enough. Moreover, the wind can change direction, blowing dust into Mammoth and other more highly populated areas.
Looking forward
Air quality monitoring data can help with policy enforcement and environmental advocacy. In places such as Mono Lake, it can additionally validate dust modelling, resulting in more accurate air pollution predictions. Partner with Clarity and implement your own accurate air quality network to protect public health and the environment.