
TL;DR: Chicago launched the largest community air quality monitoring network in the U.S., deploying 277 Node-S sensors across the city. Now, through Open Air Chicago, residents can access free, hyperlocal air quality data, track pollution trends, and sign up for health alerts.
Chicago’s air quality monitoring network
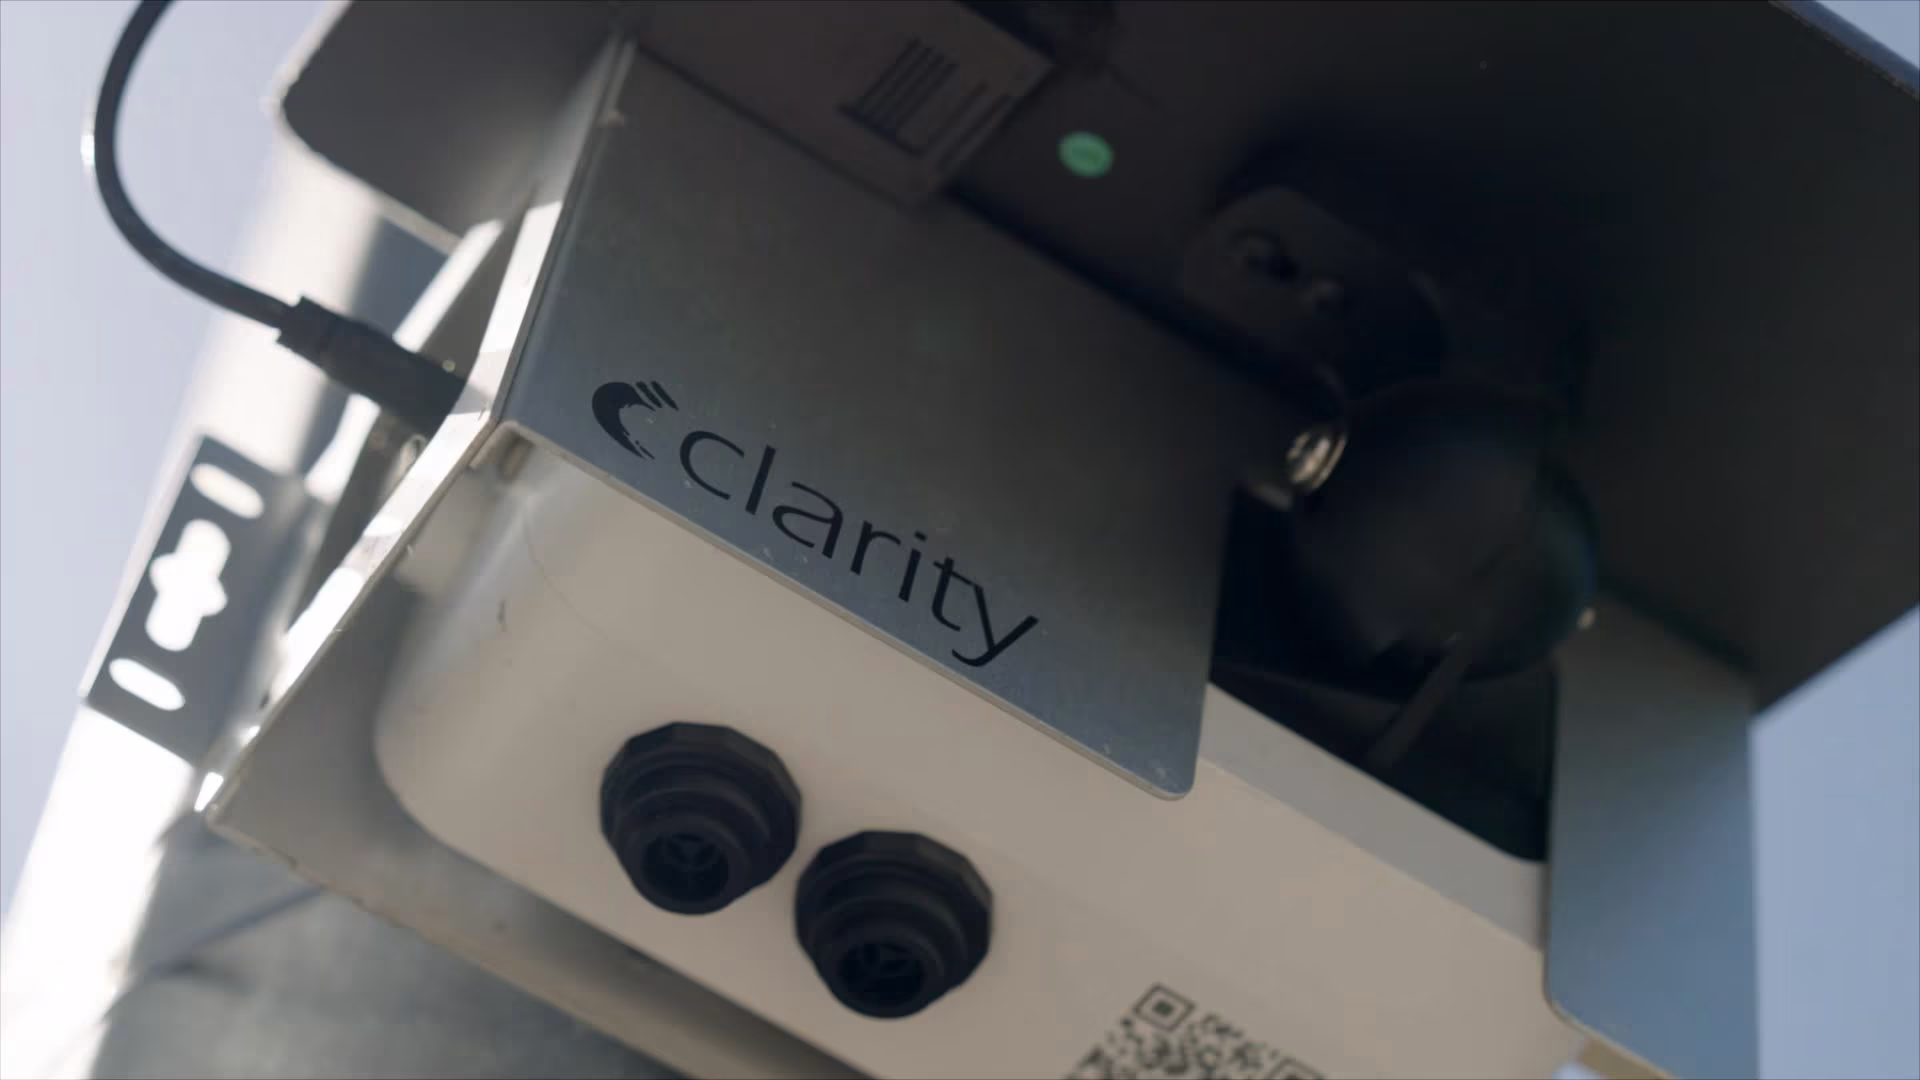
Through a partnership between the Chicago Department of Public Health (CDPH), the University of Illinois Chicago’s School of Public Health, ComEd, and other partners, 277 Node-S air quality sensors were deployed across the city of Chicago throughout 2025.
This citywide deployment represents the largest community air monitoring network in the country, and the second largest in the world.
The sensors provide hyperlocal data to supplement the city’s federal-grade monitoring system, providing a denser network with more granular data, which can help better identify neighborhood-level air quality trends and specific air pollution sources and hotspots.
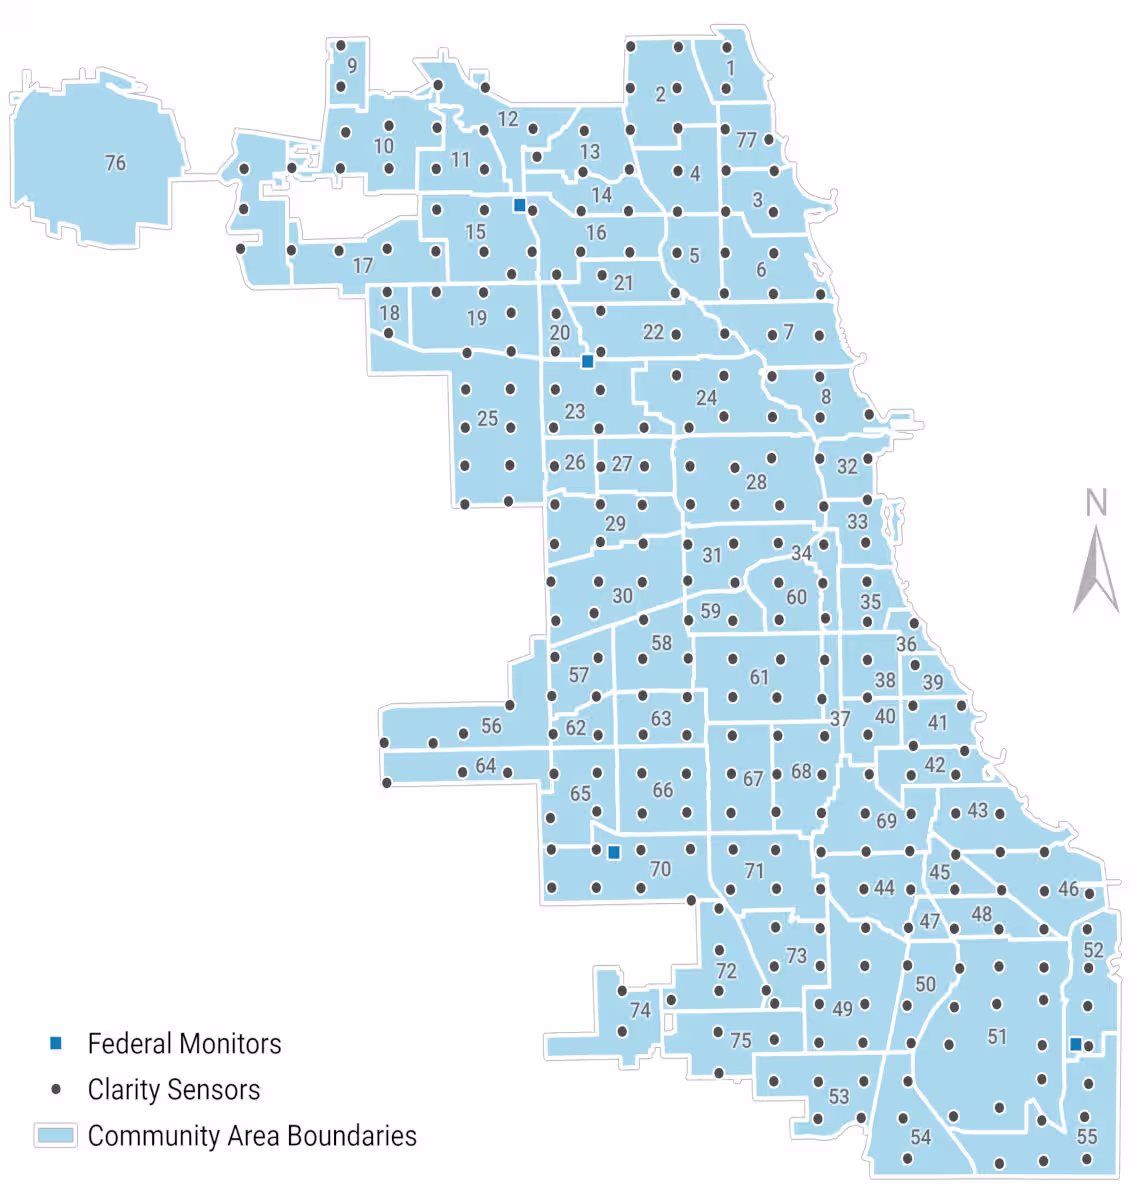
The Node-S monitors were installed in a grid-based approach, informed by the U.S. EPA Clean Air Act Network Design Criteria for Ambient Air Quality Monitoring, the Chicago Environmental Justice (EJ) Index scores, and community input. There is less than a mile between sensor locations, making sure no one is left without adequate air pollution data.
Open Air Chicago launch
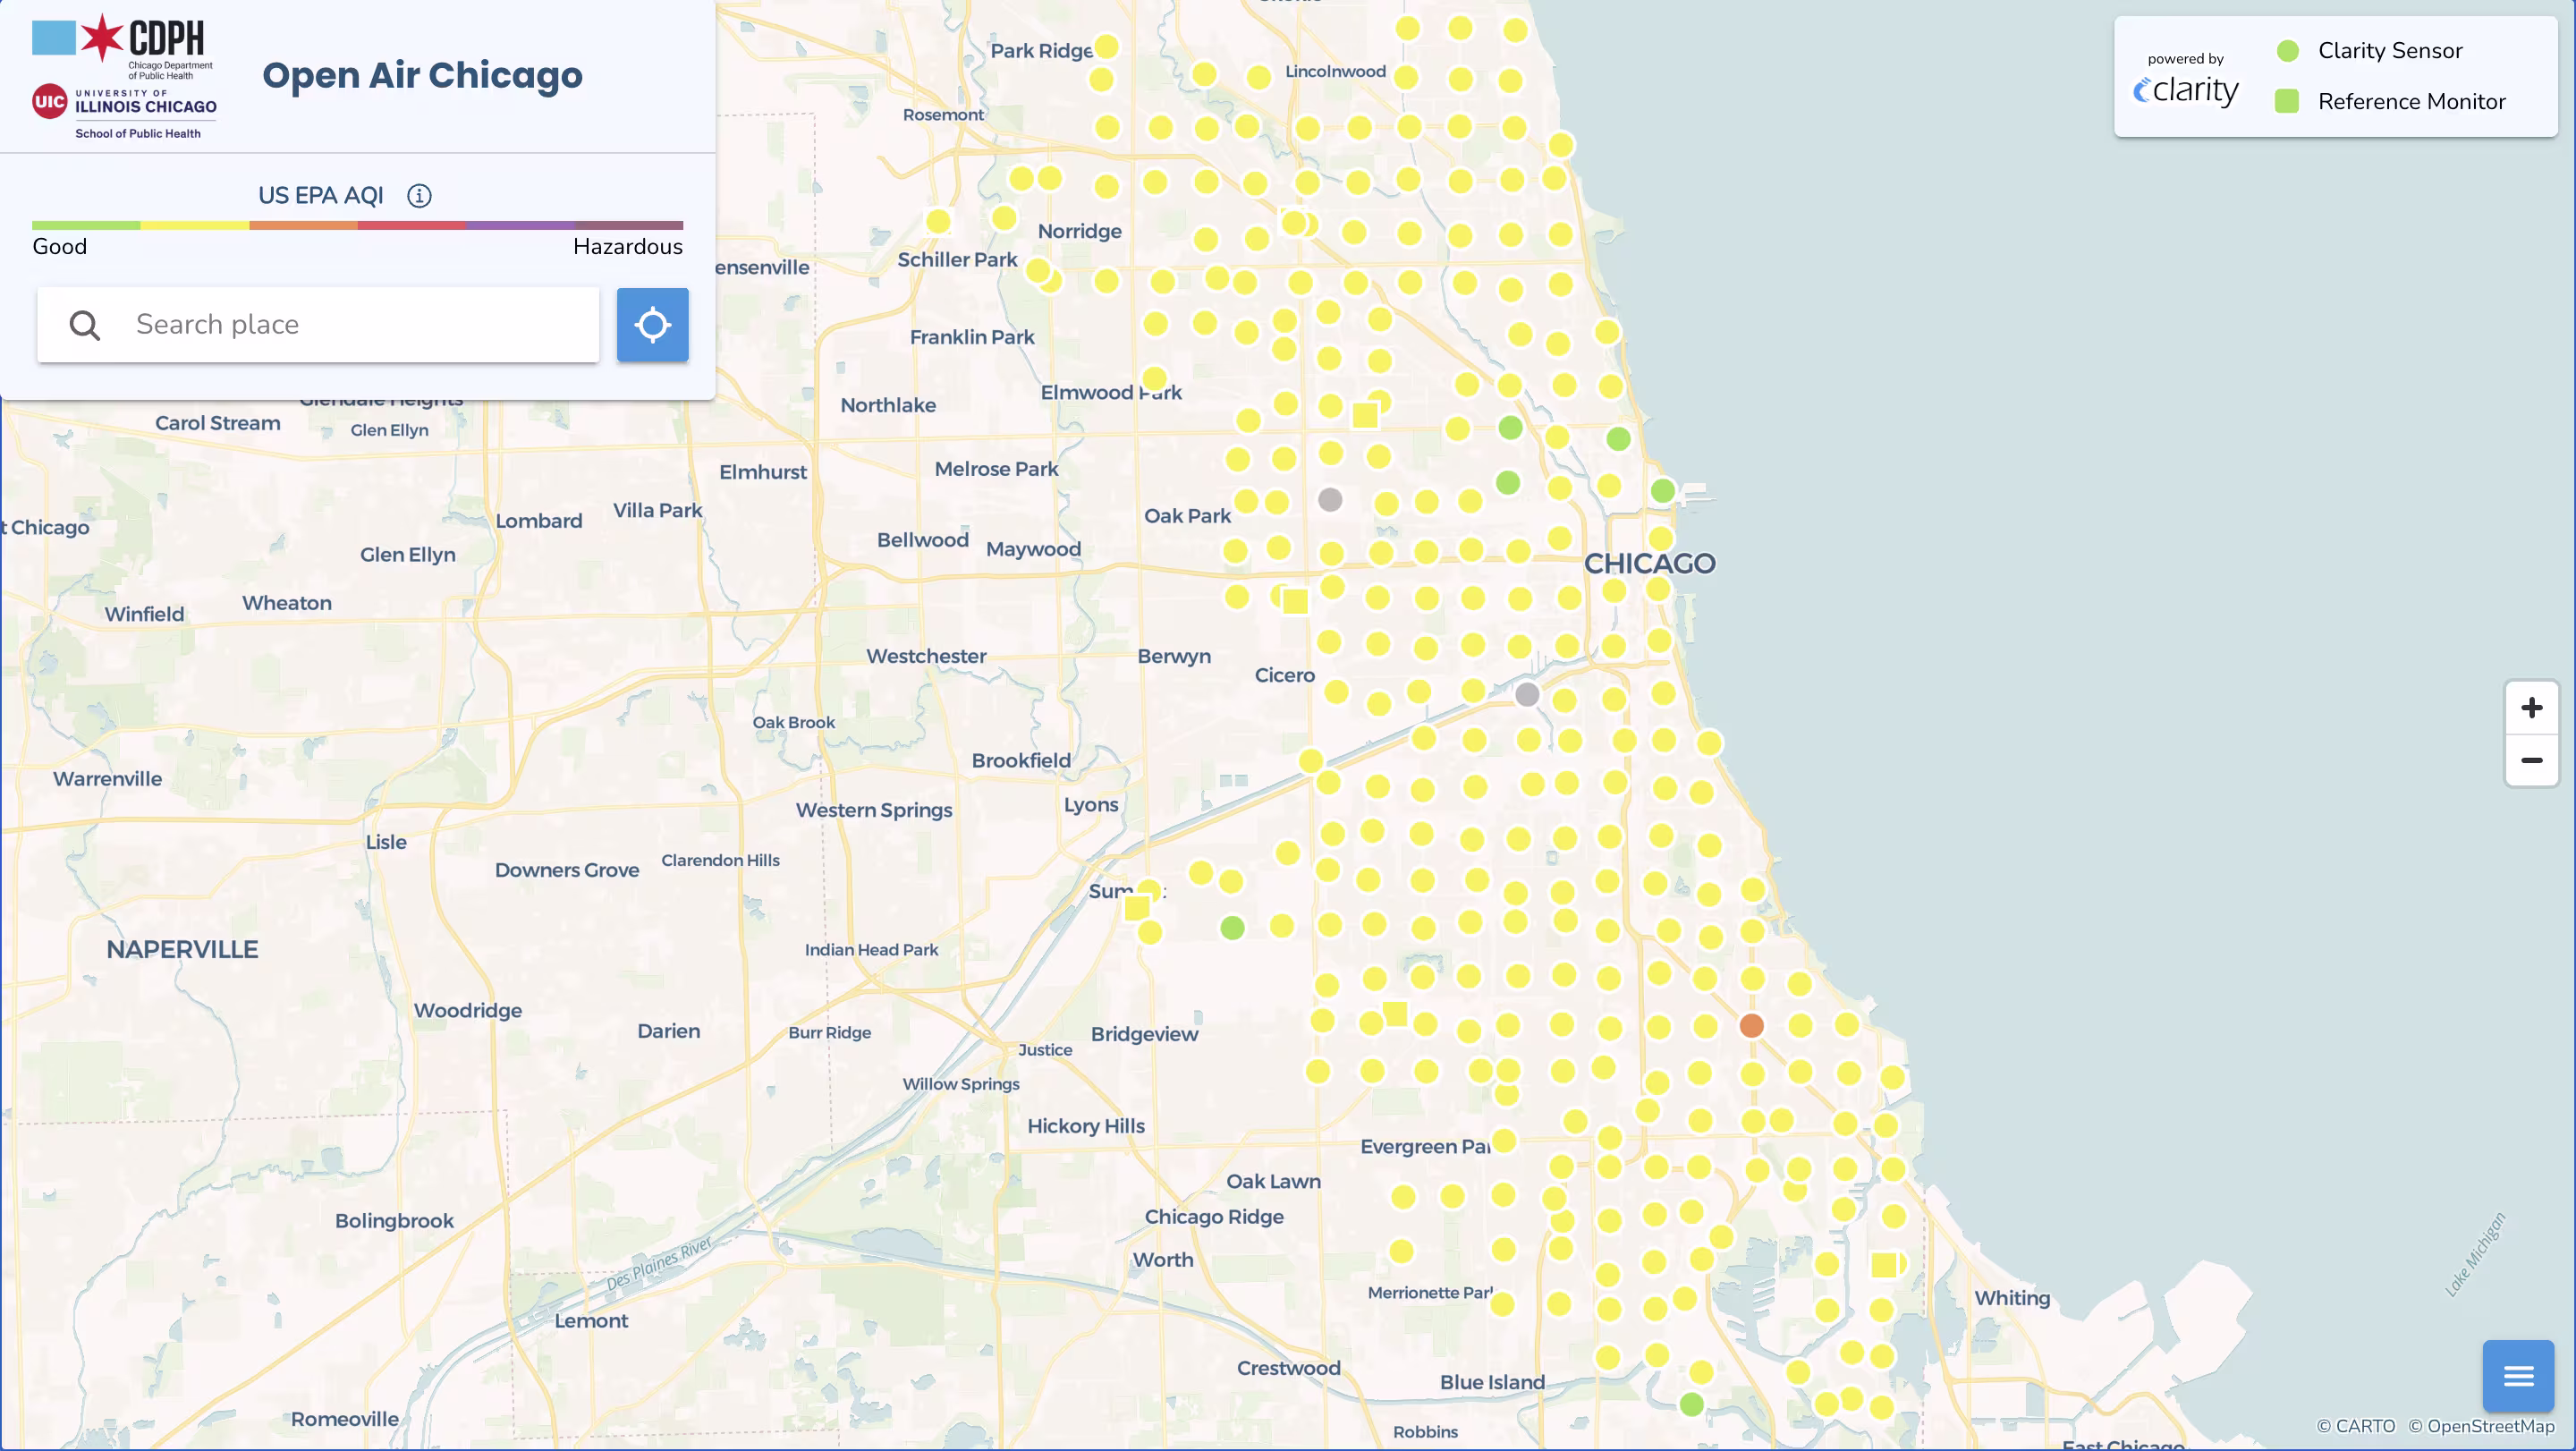
Just a few weeks ago, Open Air Chicago was officially launched, making the data from their sensors available to the public. This data can be found through Clarity OpenMap and the Chicago Open Data Portal.
The Clarity OpenMap has many helpful features to better protect local Chicago residents. This map allows users to find the sensors closest to them, assess current air quality levels, and evaluate 24-hour air pollution trends. The map also enables residents to review health recommendations related to current air quality, download data from the last 30 days from a specific sensor, and even sign up to receive alerts when the air is deemed “unhealthy.”
Through the Chicago Open Data Portal, residents can review raw and weighted data. They can download data for individual measurements as well as hourly or daily aggregations.
Looking forward
By investing in modern air quality monitoring infrastructure and providing open air quality data, Open Air Chicago ensures that Chicago residents have access to information that directly affects their health and daily life. When residents can see what’s happening locally, they can make informed choices, advocate for cleaner air, and participate more fully in conversations about environmental health. This data will help protect Chicagoans from air pollution for years to come.
If you’re interested in installing an air quality monitoring network in your city, contact Clarity to learn more or request a quote.