
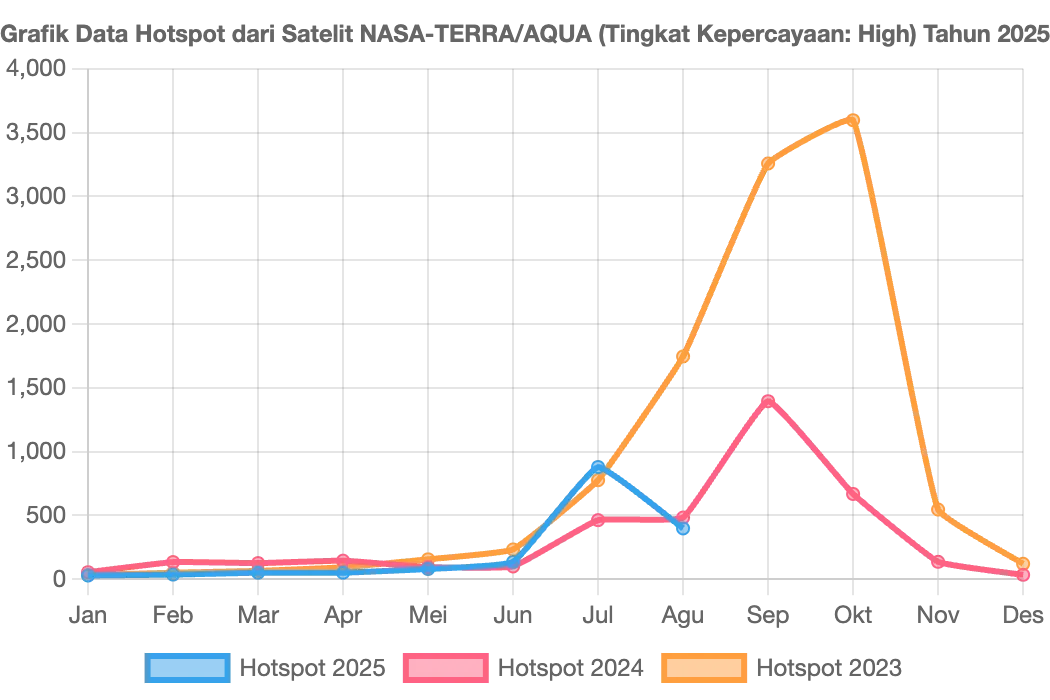
Image, provided by NASA’s Fire Information for Resource Management System, shows hotspots on August 27, 2025.
TL;DR: Global burned area from wildfires has declined over the past two decades, largely due to land use changes. At the same time, climate change is driving more intense, longer-lasting, and widespread fire seasons in many parts of the world. Regions such as North America, Europe, Australia, and parts of Asia and South America are experiencing more damaging fires. Population growth in wildland-urban interface (WUI) areas is also putting more people in harm’s way. Air quality sensors can help communities respond to rising wildfire risks.
Climate change has been increasing the severity of wildfires in many places around the world. In North America, wildfire seasons have been starting earlier and lasting longer, with record-breaking conditions occurring over the past decade. Just this year, wildfires have raged across much of Canada, Mexico, Alaska, and the Western half of the United States.
But, how have wildfires been affecting the rest of the world in recent years, and which areas have been most impacted by climate change?
Land use change
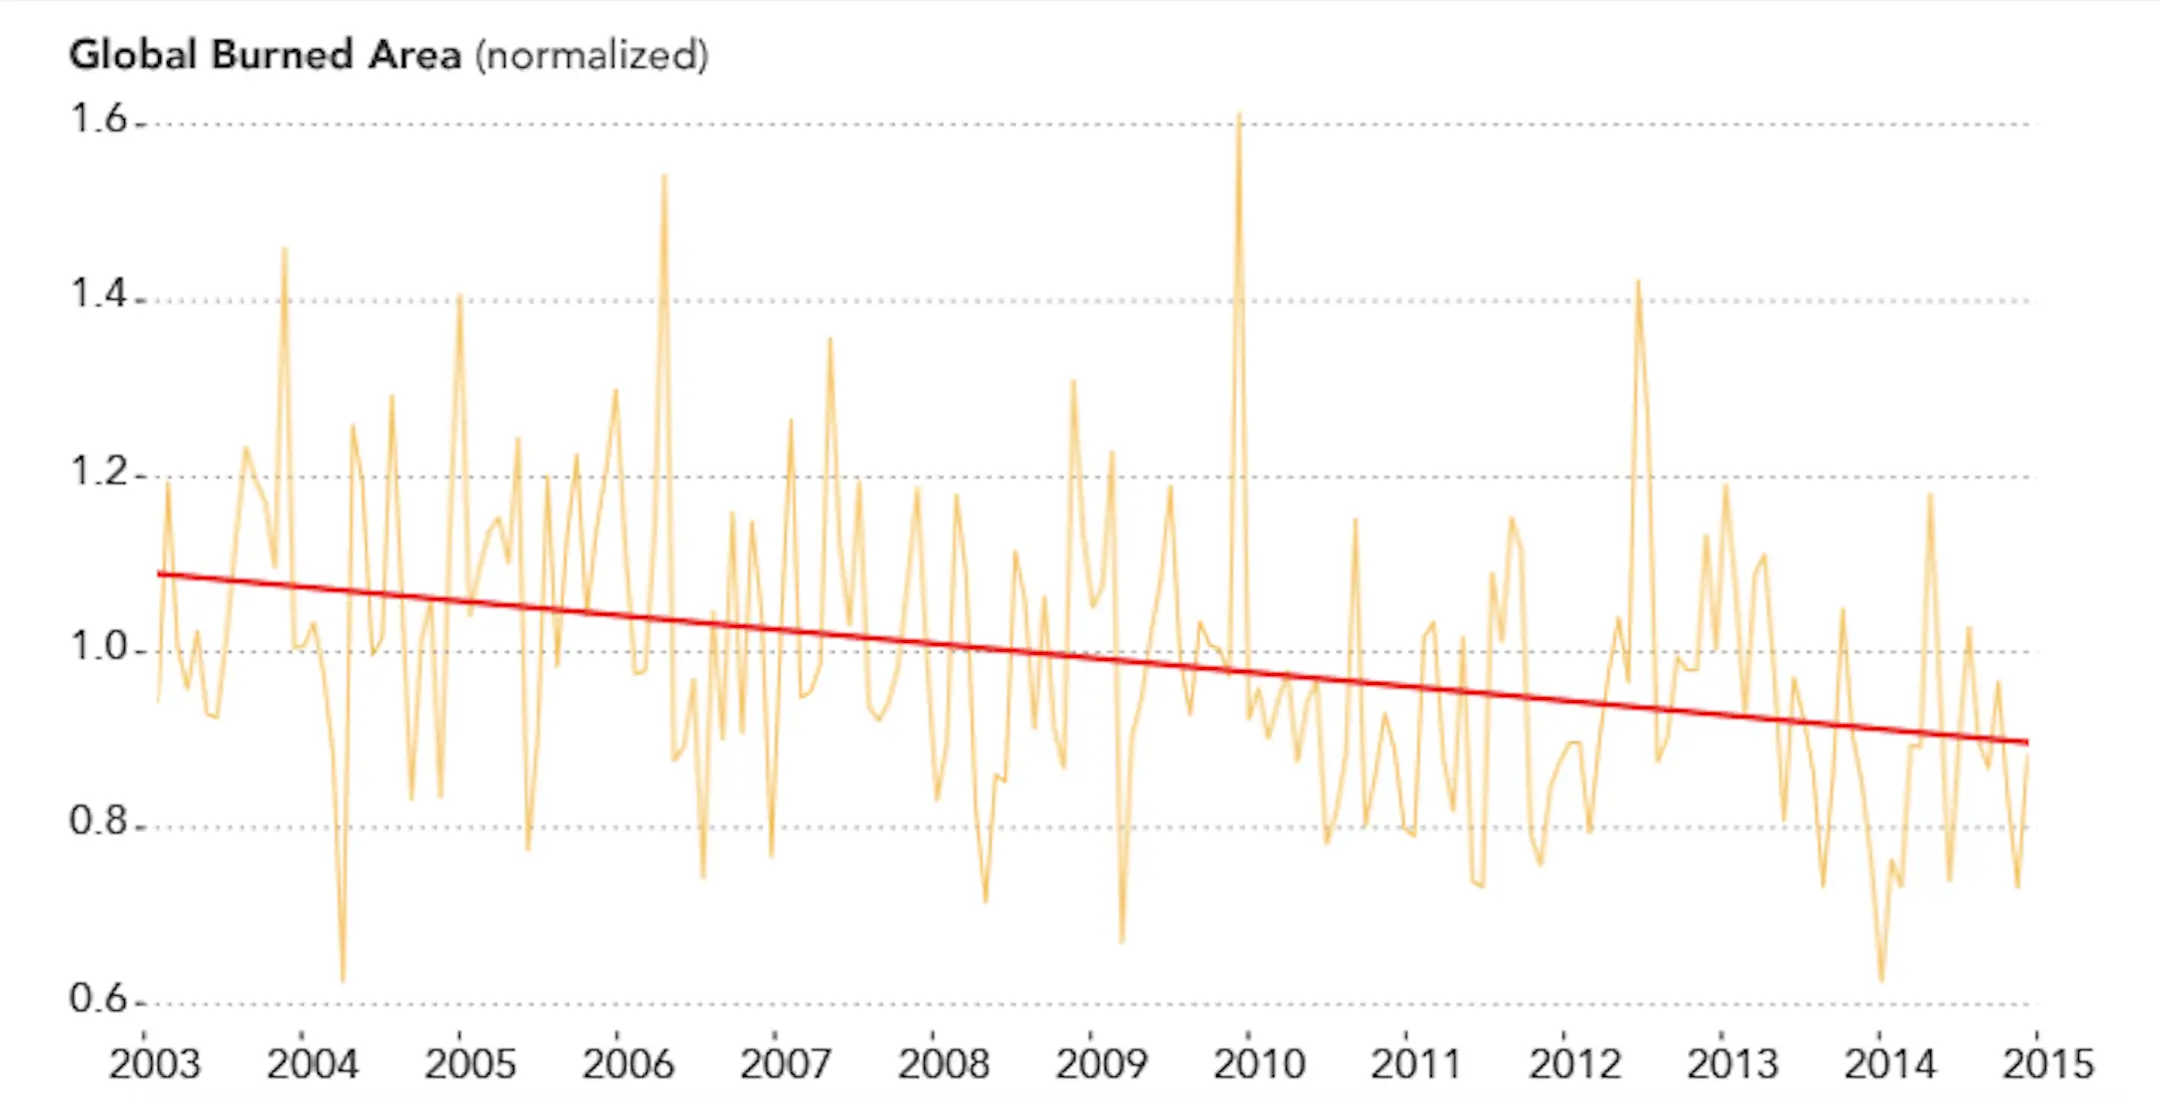
Not every part of the world has experienced a dramatic increase in fires. In fact, globally, there has been a decrease in the total number of square kilometers burned each year. Between 2003 and 2019, the total number of burned kilometers dropped by roughly 25%. This might seem counterintuitive because of the warming climate. However, the reason for this change has to do with land use rather than global warming.
Areas such as Asia’s grasslands, South America’s tropical forests, and Africa’s savannas have historically seen the use of fire by nomadic cultures for land clearing. However, as people in these regions shift to settled lifestyles and different agricultural practices, fires in these regions have been decreasing. Communities have even been enforcing more fire suppression to protect settlements.
This trend is significant in Africa because of how much land is burned there annually. Satellite data spanning from 1998 to 2015 shows that Africa is responsible for burning roughly half the size of the continental United States every year. Yet, this number is in decline. By 2015, African savanna fires had already decreased by about 700,000 square kilometers, an area roughly the size of Texas.
The consequences of land use change
The consequences of this development are more complex than they initially seem. On the one hand, fewer fires are better for air quality and release less carbon dioxide into the atmosphere, resulting in a smaller contribution to global warming.
On the other hand, not all fires are equal. While severe burns are detrimental, milder blazes are actually healthy for ecosystems. Savannas and grasslands, for instance, actually need fire to maintain healthy ecosystems and habitat conservation. Yet, these are the locations that are seeing the greatest decline in burned area. Moreover, too much fire suppression can actually lead to more severe wildfires in the long term.
Even as land use changes have been decreasing blazes in some parts of the world, other parts have seen an increase in fires, largely due to global warming. According to an attribution study, the decline in the area burned globally by wildfires over the 20th century due to land-use change has been almost entirely offset by the increase due to global warming. Taking into account both trends, the global burned area has only declined by 5% over the past 100 years.
Also, a decline in global fires does not necessarily reflect the number of people affected by wildfires. This is because fires that burn far away from human settlements will not impact communities as much.
Between 2002 to 2021, the population directly exposed to wildland fires actually increased by 40% globally. This is because more people are living in Wildland-Urban Interface (WUI) areas. These are locations where wildlands meet human settlements. People living in WUI areas face a greater exposure to wildfires and subsequent smoke.
Where are wildfires increasing?
Africa
Even with land use change causing fires to decrease across African savannas, Africa is still experiencing a high number of blazes. In fact, many people in Africa are moving to WUI areas, increasing their exposure to wildfires. The African population accounts for more than 85% of all people directly exposed to wildland ignitions between 2002 and 2021.
Moreover, Africa’s wet, tropical forests are seeing an increase in wildfires. Between 2003 and 2021, the number of fires in these areas has typically doubled, especially in the Congo Basin. This change is largely due to deforestation and climate change.
Some parts of Southern Africa and the country of South Africa have been seeing an increase in wildfires over the past few years, as shown by the devastating Southern Cape fires in 2017.
Europe
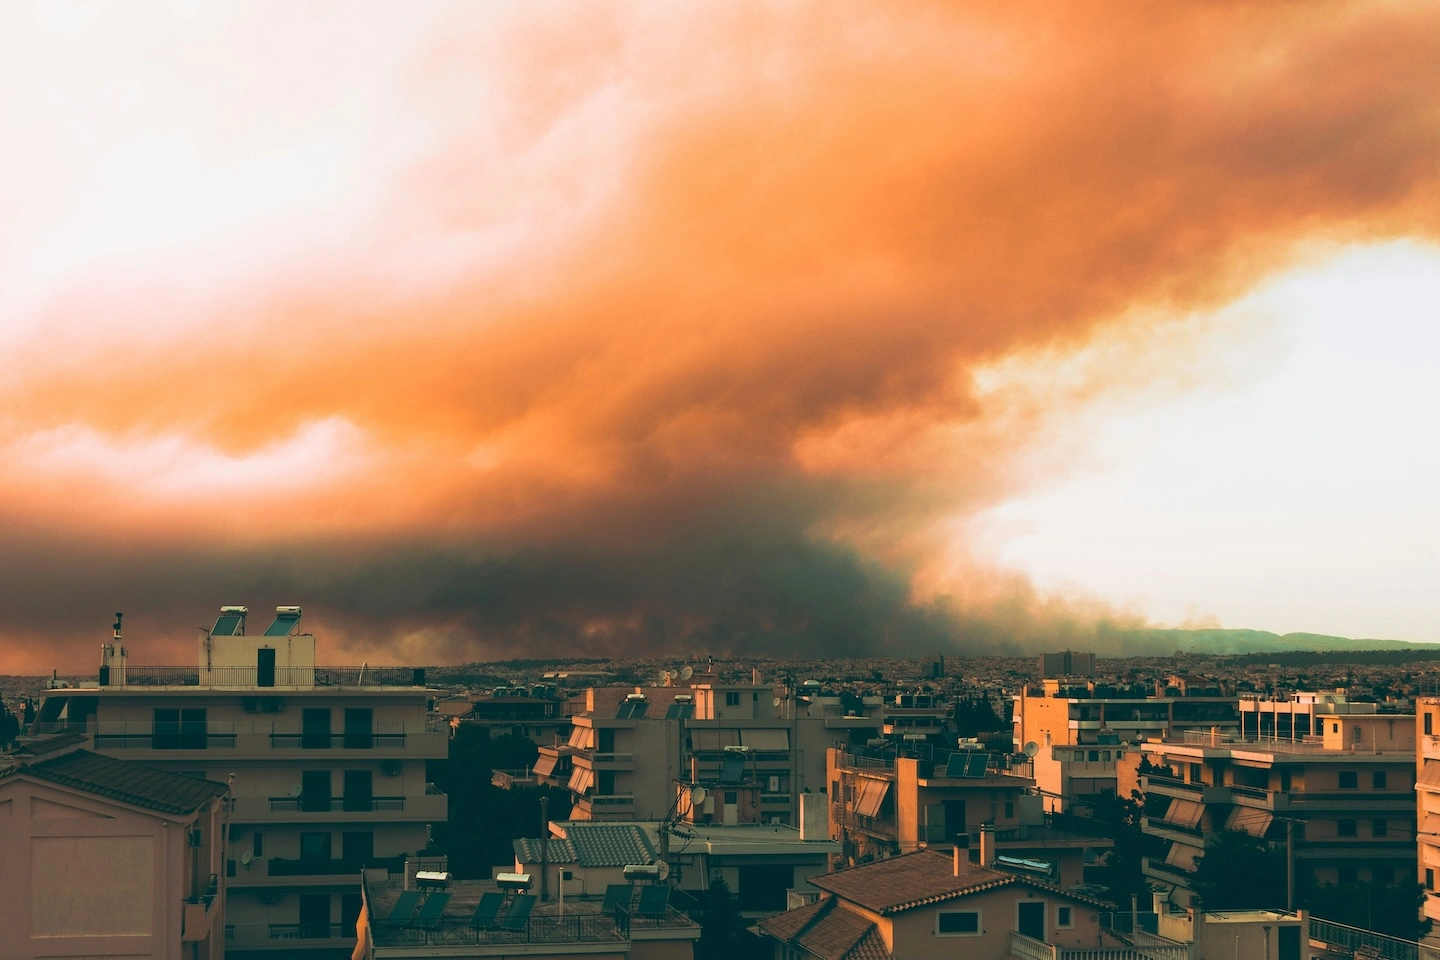
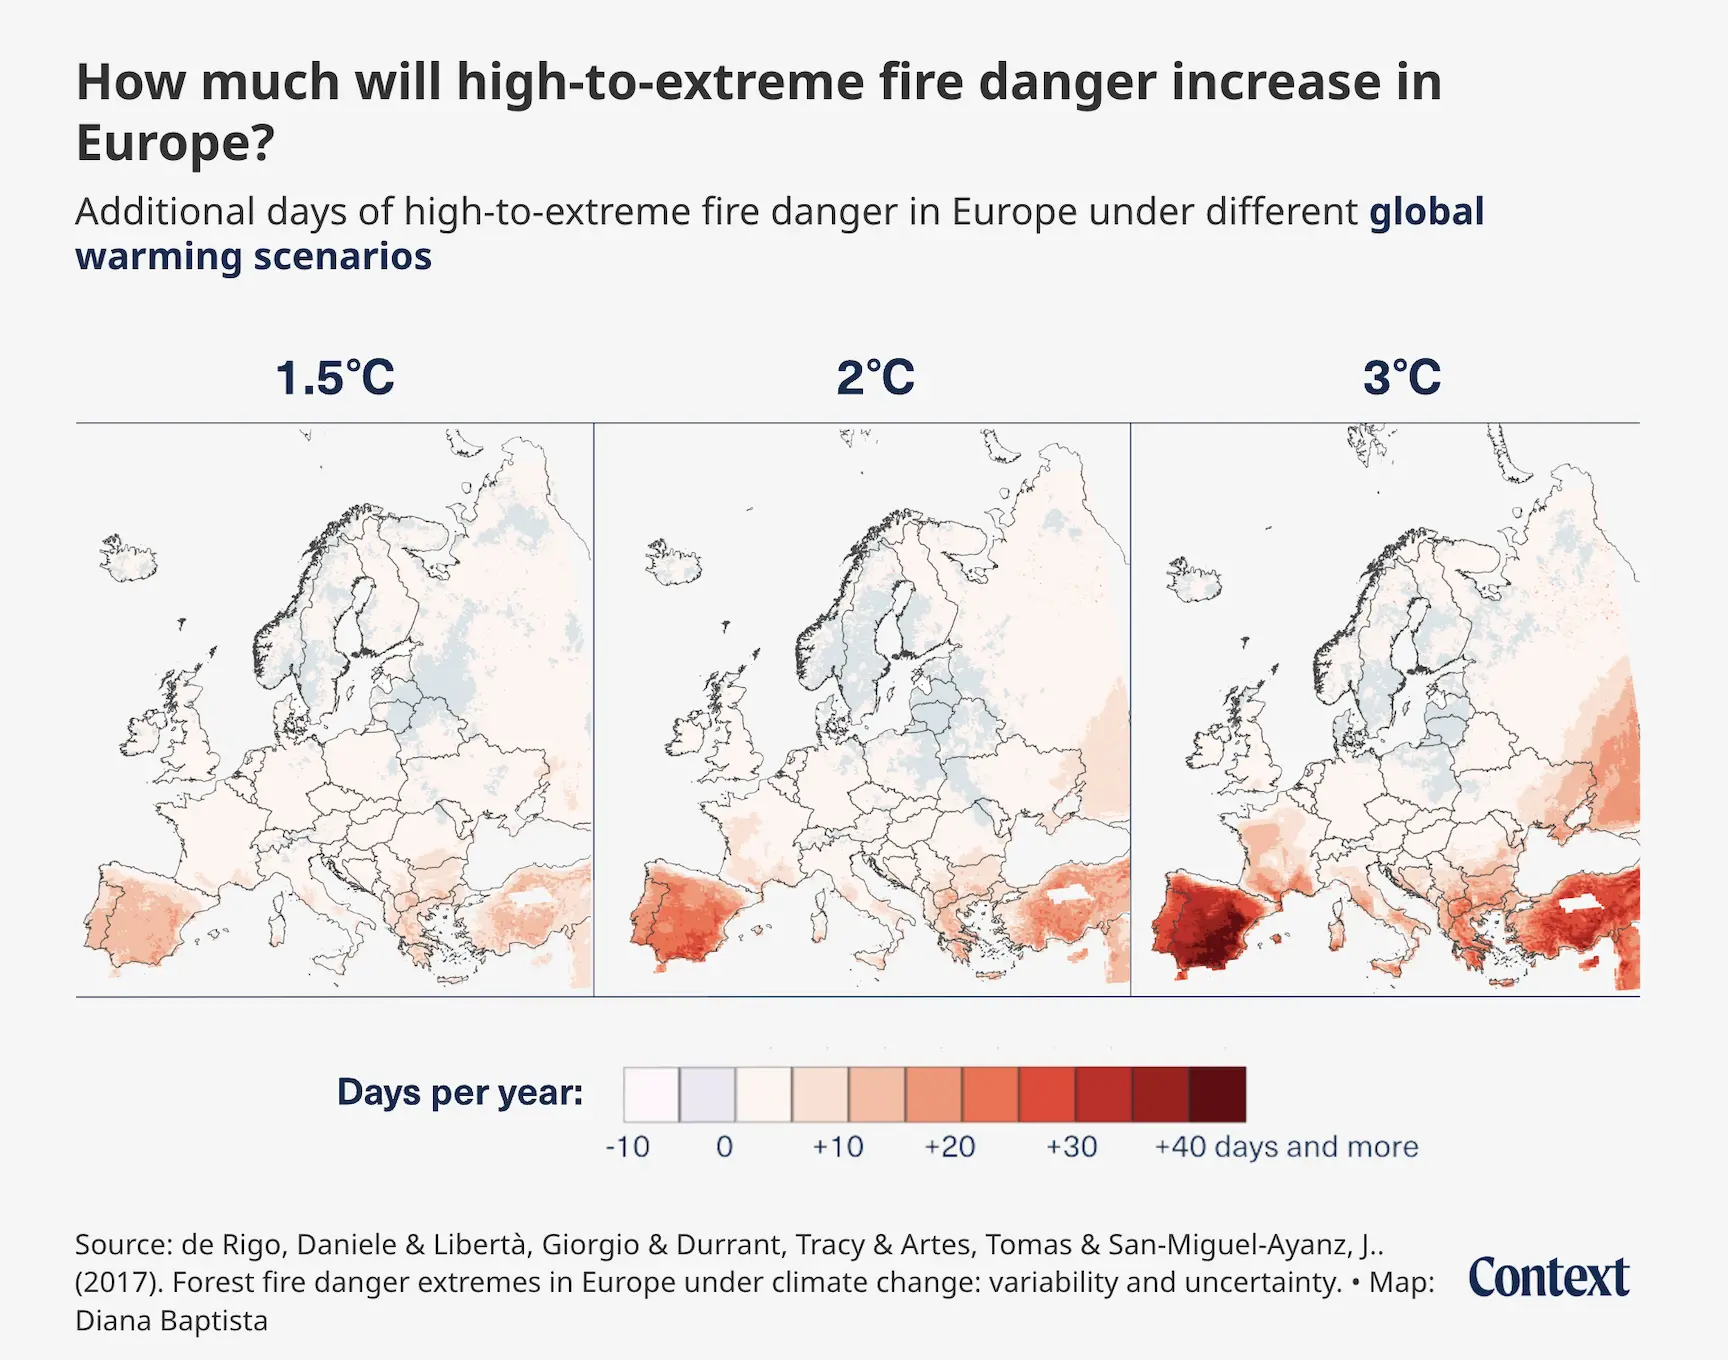
Europe has been heating up at a faster rate than the global average. Consequently, many countries in Europe are experiencing an increase in wildfire activity, with the last few years seeing record-breaking conditions.
This year has been particularly devastating in many parts of Europe, where fires have burned across Spain, Portugal, Italy, and Greece. Southern Europe is particularly vulnerable to burning and could experience up to a tenfold increase in wildfire activity under projected climate change conditions.
This year, Fires additionally affected Turkey, Ukraine, Romania, the Balkans, France, Ireland, and the United Kingdom. Wildfire risk is even rising in areas that have not historically been as exposed, such as Czechia, Germany, and Sweden.
Asia
While some parts of Asia have seen a decrease in fires due to land use change and differing agricultural practices, other parts have seen an increase in recent years. Eastern Asia has experienced recent and severe wildfire activity. In 2025, South Korea faced its deadliest infernos on record, with Japan also experiencing wildfires.
Even places where fires are decreasing overall, such as Indonesia, still see some upticks and hotspots. Indonesia had one of its worst wildfires in recent memory in 2025.
Eurasia has seen increases in wildfire activity in certain areas. Over the past decade, the number of forest fires has increased by 2.5 times in Kazakhstan. In Russia, wildfires have also been increasing. This year, Russia saw intense wildfire activity, with smoke spreading all the way to the Sea of Japan. In 2020, blazes in Siberia burned over 20 million hectares of the Russian landscape, and roughly 10.9 million hectares of forest.
Australia
Southern Australia has been seeing a trend of drier conditions due to climate change. A study found that the annual area burned across Australia’s forests has been increasing by roughly 48,000 hectares per year over the last three decades. Extreme forest fires are becoming more common, and the fire season in Australia is growing longer, stretching into autumn and winter.
The Black Summer forest fires of 2019-2020 were particularly devastating. Up to 19 million hectares were burned, over 3,000 homes were destroyed, and 33 lives were lost as a direct consequence of the blazes. The smoke from the Black Summer fires caused the deaths of nearly 450 additional people.

South America
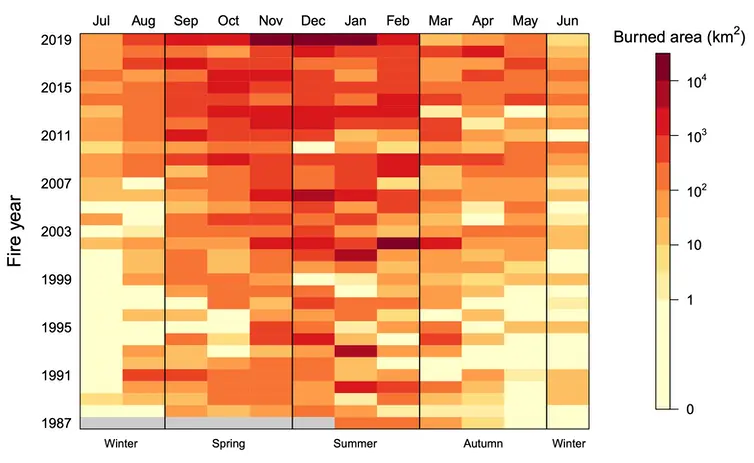
Wildfire activity has been increasing across much of South America, even amid a reduction in deforestation rates and some land use change. Amazon Rainforests, which under natural conditions rarely burn, have been burning more frequently due to drought and the expansion of industrial agriculture. In fact, by 2050, the Amazon basin may reach a tipping point where the world’s largest tropical forest may become so fragmented that it is no longer able to retain sufficient moisture to sustain itself.
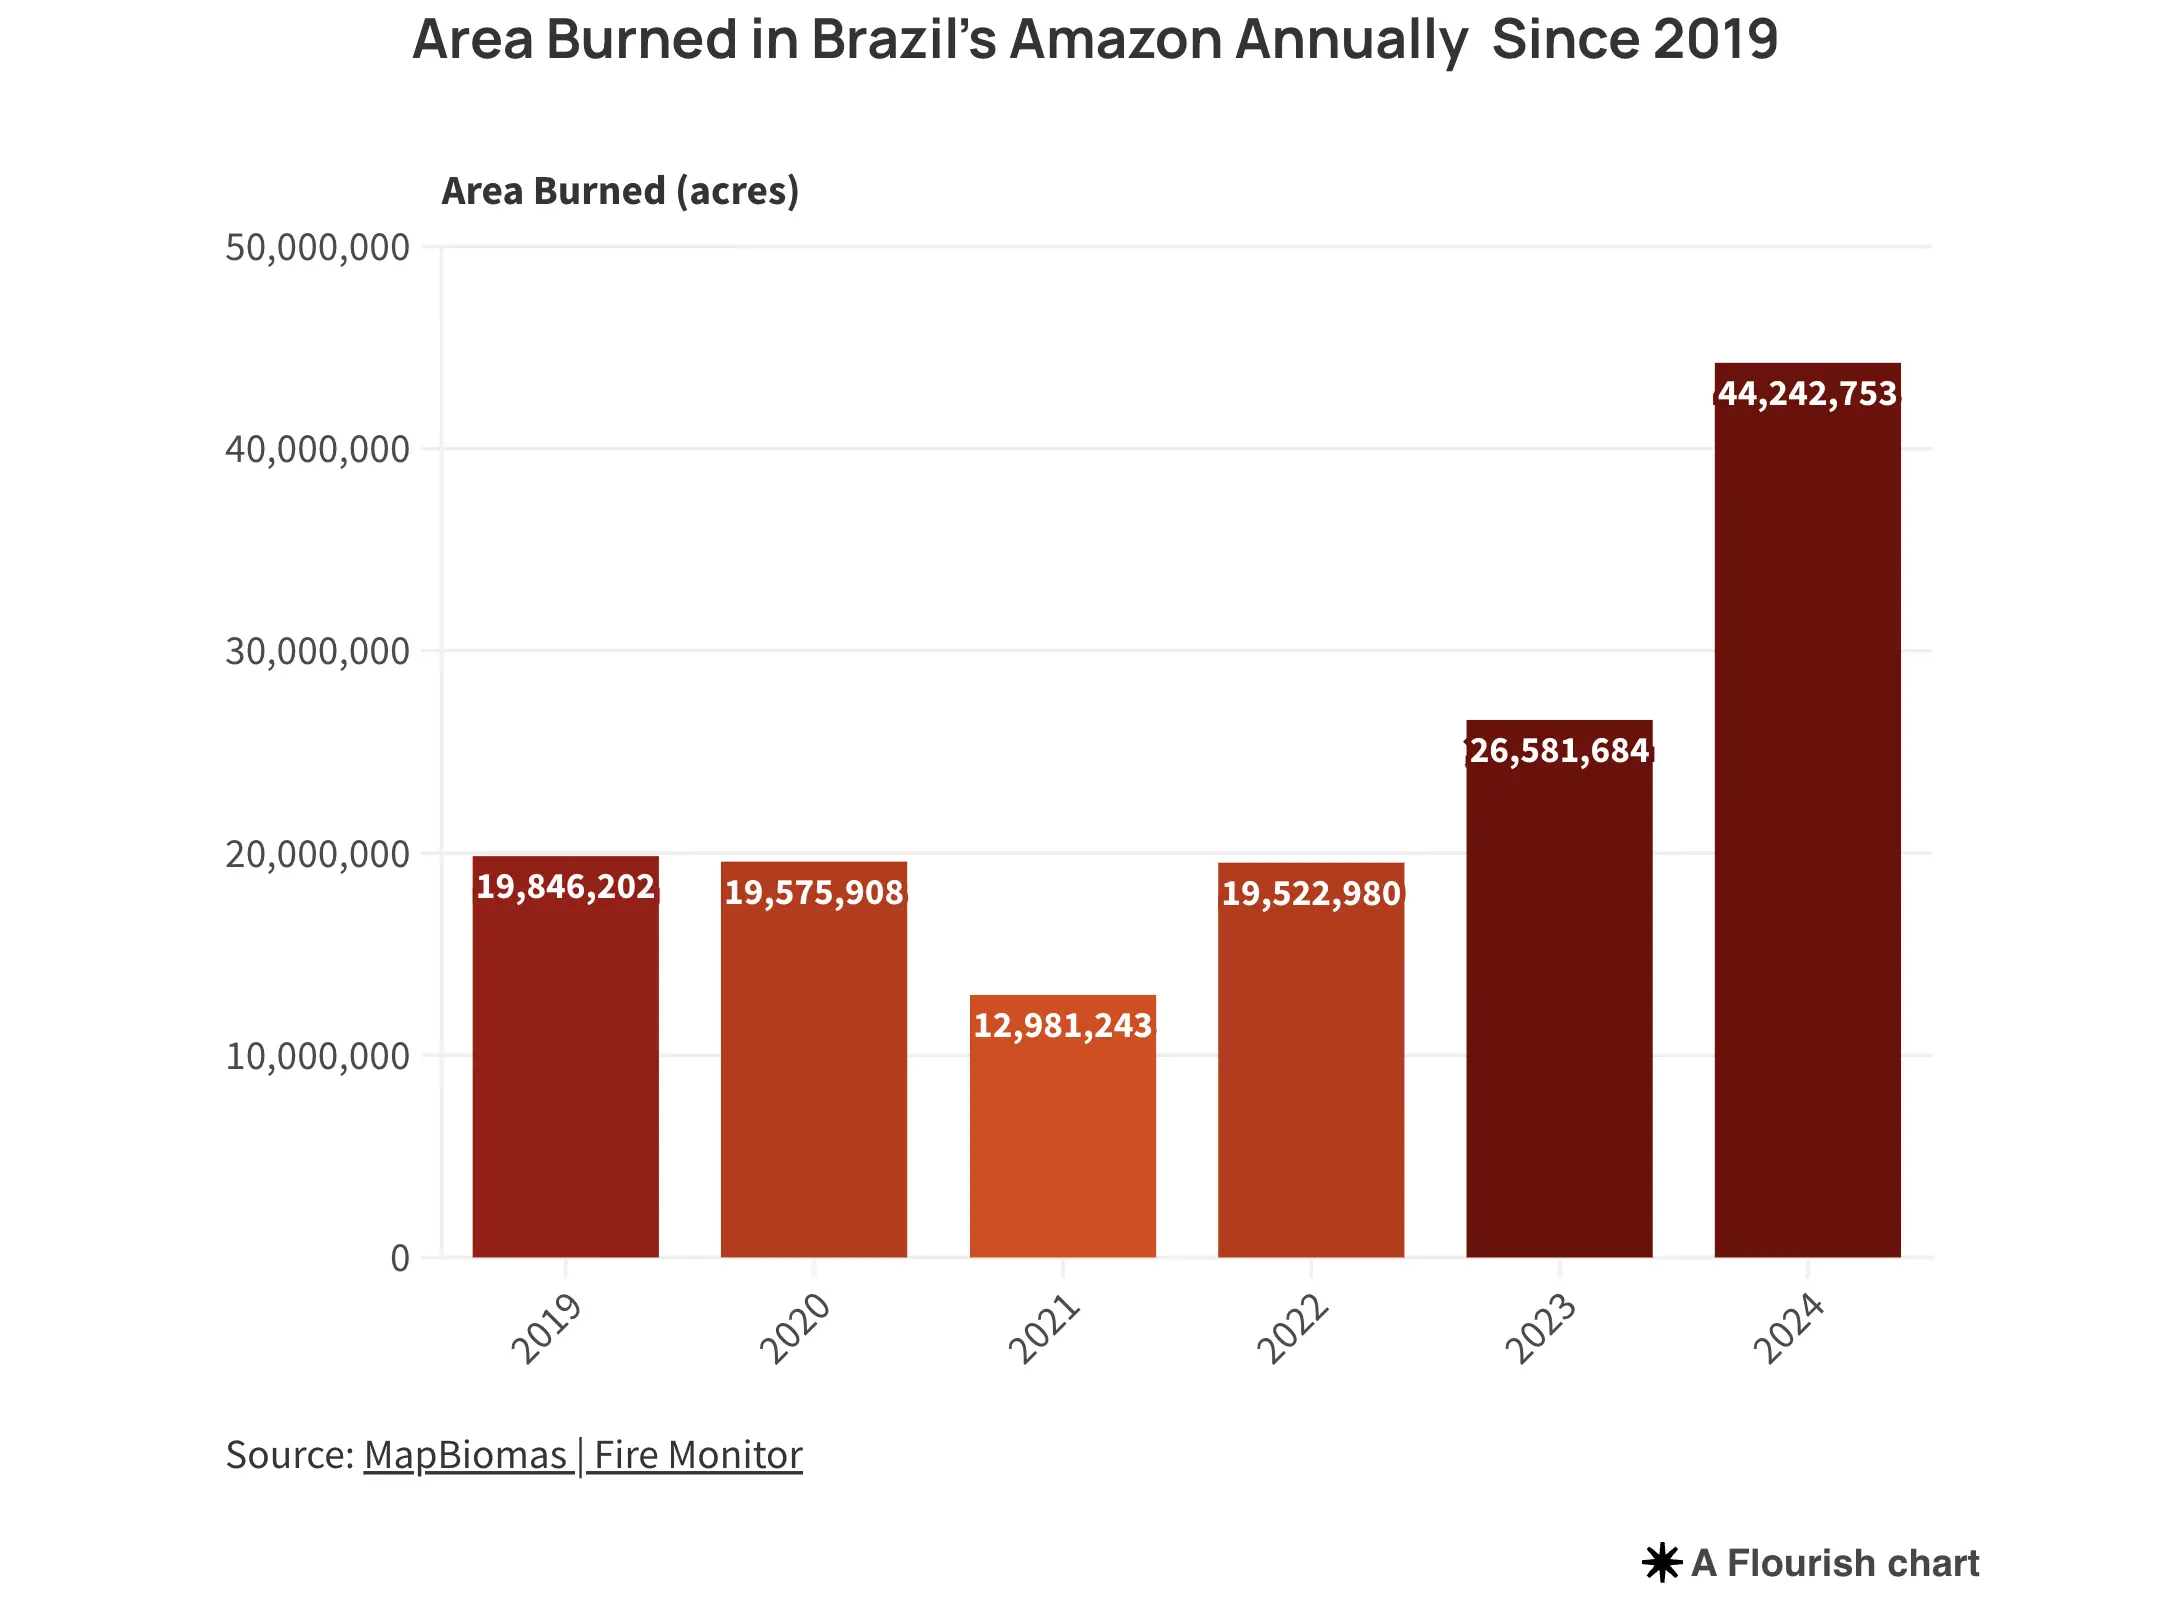
2024 was a particularly severe wildfire season for South America. In Bolivia, more than 10% of the country burned, releasing 33 million metric tons of carbon dioxide between May and August of that year. By September 2024, 346,122 hotspots were identified across 13 countries. By the end of the year, the number of fire outbreaks rose to 511,575, with over half occurring in Brazil. Due to drought, even tropical wetlands, like the Pantanal, saw millions of acres burned, affecting important wildlife and ecosystems.
Looking Forward
Even with a global decrease in burned area, we need to address the increasing severity of wildfires in many places around the world and the threat of climate change.
In the event of a wildfire near you, take the appropriate precautions to protect yourself and loved ones. Be sure to check your local Air Quality Index (AQI) to best protect against smoke. Resources such as Clarity’s OpenMap and AirNow’s Fire and Smoke Map both show reliable local AQI.
To build your own ambient air quality measurement network, partner with Clarity to find a solution.