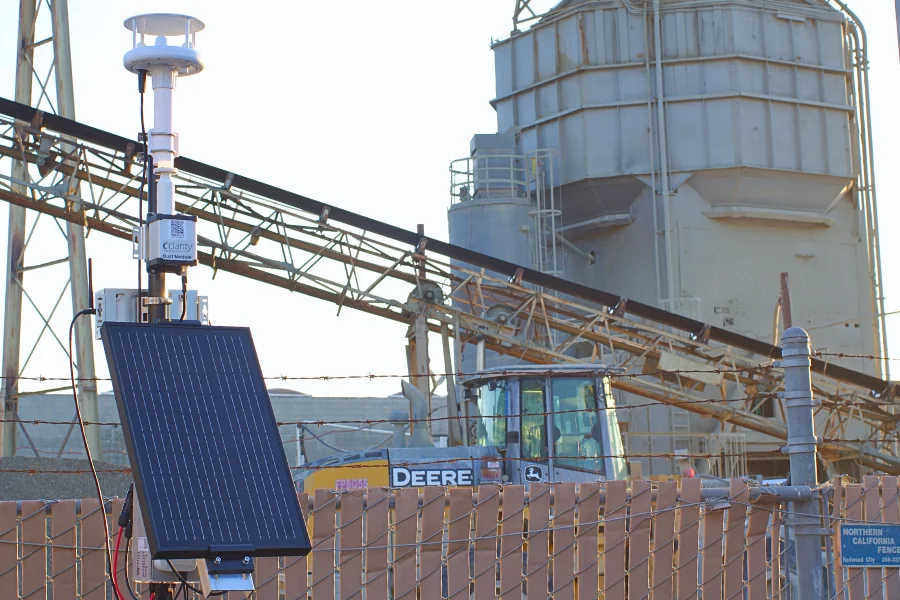
Real-time PM10 and fenceline monitoring for construction and demolition
Demolition, earthworks, and heavy plant put PM10, PM2.5, and diesel emissions over the site boundary and into neighbouring homes. Clarity Movement's solar-powered, cellular-connected monitors give site and environmental managers real-time dust data with threshold alerts, so you can act before a complaint lands and hand the local authority a clean monitoring record.








Why monitor
Construction is one of the largest sources of coarse dust in cities. Dust travels, complaints follow it, and planning conditions increasingly require a dust management plan backed by continuous boundary monitoring rather than visual checks. Demolition, earthworks, cutting, and trackout release PM10; diesel plant and non-road mobile machinery add PM2.5, nitrogen dioxide, and black carbon.
A Clarity network puts a monitor upwind and downwind of the works and near sensitive receptors such as homes, schools, and hospitals. Threshold alerts reach the site manager within minutes of a dust event, and the data record informs permit reporting and answers the local authority when they ask what happened on a given day.
Medium and high-risk sites are expected to run continuous PM10 monitoring with a baseline before works begin.
Real-time data lets you show what the site did and did not emit, instead of arguing with a photo of a dust cloud.
PM10 and diesel soot from plant and machinery affect the crew first and the neighbourhood second.
What a construction site puts into the air, and what we measure
Add-On Modules connect to the Node-S, so one network can grow from PM10 to a full fenceline profile without replacing hardware.
Compare
Two questions decide it: will the monitor catch a dust event at the concentrations construction produces, and will the data stand up when someone asks for it?
| Criteria | Clarity Node-S + Dust Module | Typical low-cost PM sensor | Rented reference-style monitor |
|---|---|---|---|
| PM10 at construction-level dust | Enhanced optics and heated inlet; MCERTS-certified with a PM10 performance range of 0 to 374 µg/m³ | Often under-reads coarse dust and saturates in heavy events; most are certified at ambient levels only | Accurate, but typically mains-powered and sized for one fixed point |
| Siting | Solar or external power, cellular or satellite, mounts on hoarding or a pole in minutes | Needs Wi-Fi or mains; usually indoor-grade enclosures | Needs mains power, a secure cabinet, and a technician visit to move |
| Alerts | Threshold alerts by email and SMS from the Clarity Dashboard, with site-specific action levels | App notifications, rarely configurable per site | Depends on the rental provider's telemetry |
| Data ownership and export | Your data, exportable from the Dashboard and API, shareable with the local authority | Vendor cloud, limited export | Provider reports, often monthly |
| Calibration and support | Factory calibration plus collocation procedure; remote device health; support included in the subscription | None after purchase | Included in rental, at a higher day rate |
| Cost model | Annual Sensing-as-a-Service subscription; monitors move to the next site | Low purchase price, no support | High weekly or monthly rental per unit |
Customer story

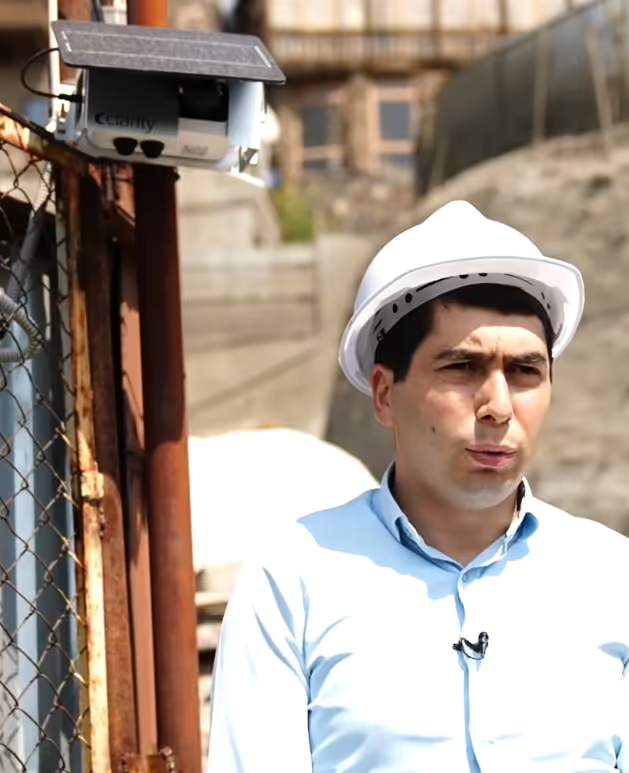
Yerevan's construction boom was pushing dust into residents' air, so the City Council required continuous air quality monitoring at high-risk sites. The Technology Management Center of Yerevan City needed monitors that would work without mains power or Wi-Fi at dozens of private sites, and after a year-long pilot chose the solar-powered, cellular-connected Node-S.
Around 170 sensors now cover all 12 districts, with at least two at every major site. Dust spikes trigger alerts to inspectors, the data runs into the city's GIS platform through our API, and residents can check their own district on a public dashboard. Developers pay for the sensors that watch their sites, which keeps the network funded as the city grows.
“After the installation of the equipment, public discussions about air pollution intensified. This led to new regulations and stricter administration, especially in the construction sector.”Sargis Manukyan, Director, Technology Management Center of Yerevan CityRead the full customer story →
Dust Measurement Suite
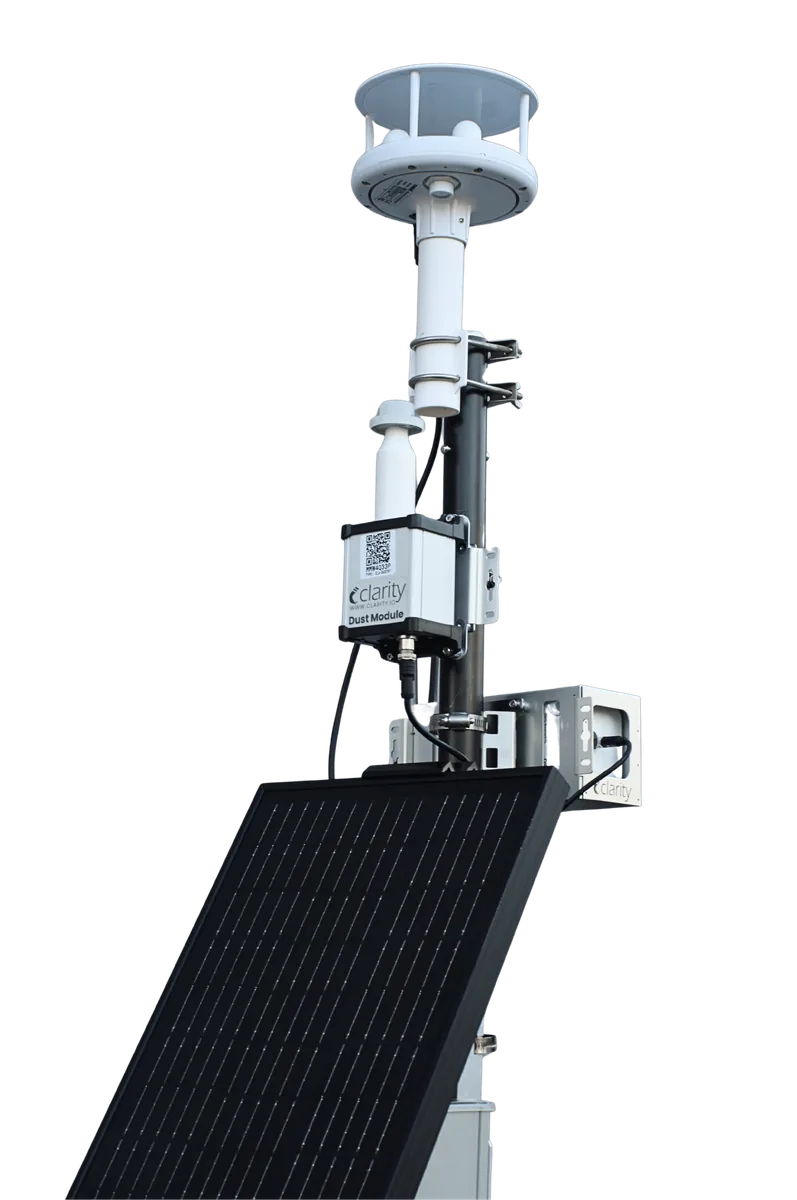
The Dust Measurement Suite is a turnkey kit for jobsite dust monitoring: the MCERTS-certified Dust Module for PM10, the Node-S for PM2.5 and NO₂, the Wind Module for source attribution, and an external solar power system, all reporting to a construction dust dashboard with email and text alerts. Light enough to carry onto site, quick to mount on hoarding or a pole, and ready to move to the next project when this one wraps.
Enhanced optics and a heated inlet deliver near-reference PM10 at the concentrations construction produces.
Upwind and downwind pairing with wind data separates site-generated dust from background.
Real-time alerts when a 10-minute or 24-hour rolling average crosses the action level you set.
Runs through the working day on solar or built-in battery power, with no mains connection on site.
Deploys in any environment, from a fence line in a city centre to a remote earthworks site.
Exportable, time-stamped records for permit reporting and the dust management plan.

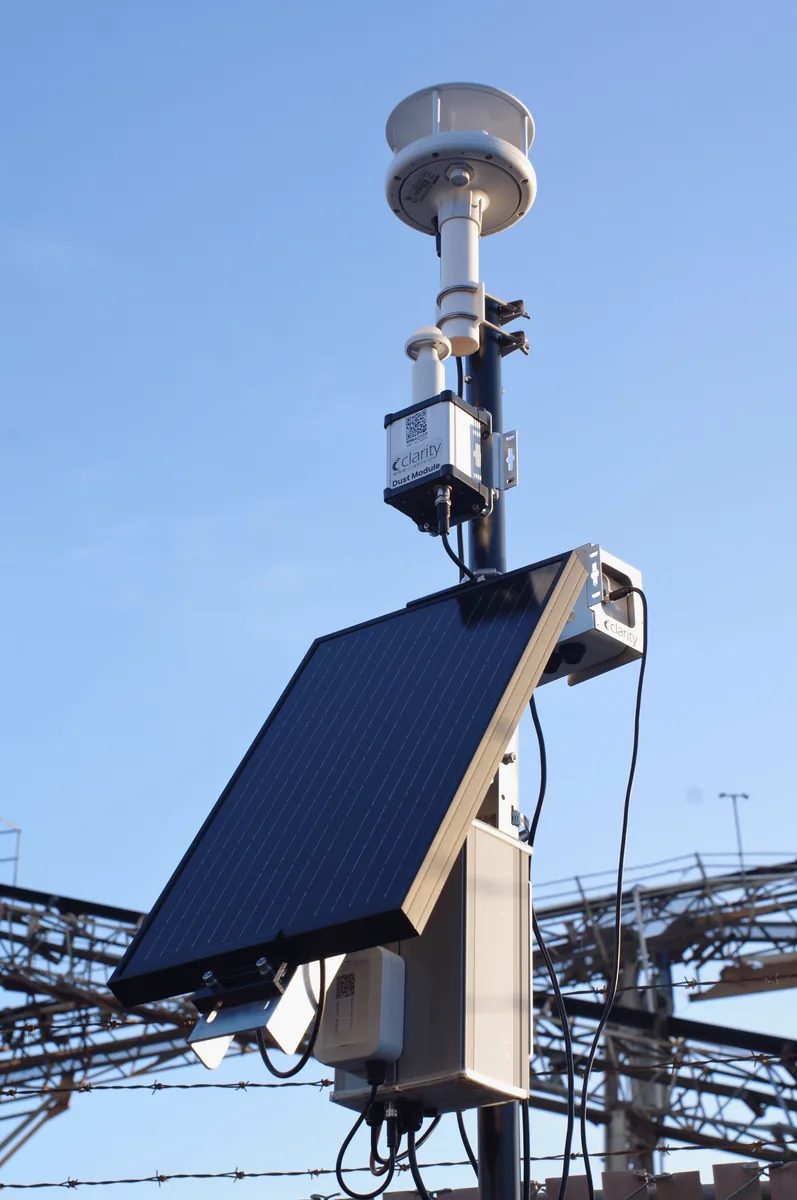
Dust Measurement Suite: Node-S, Dust Module, Wind Module, and solar power system.

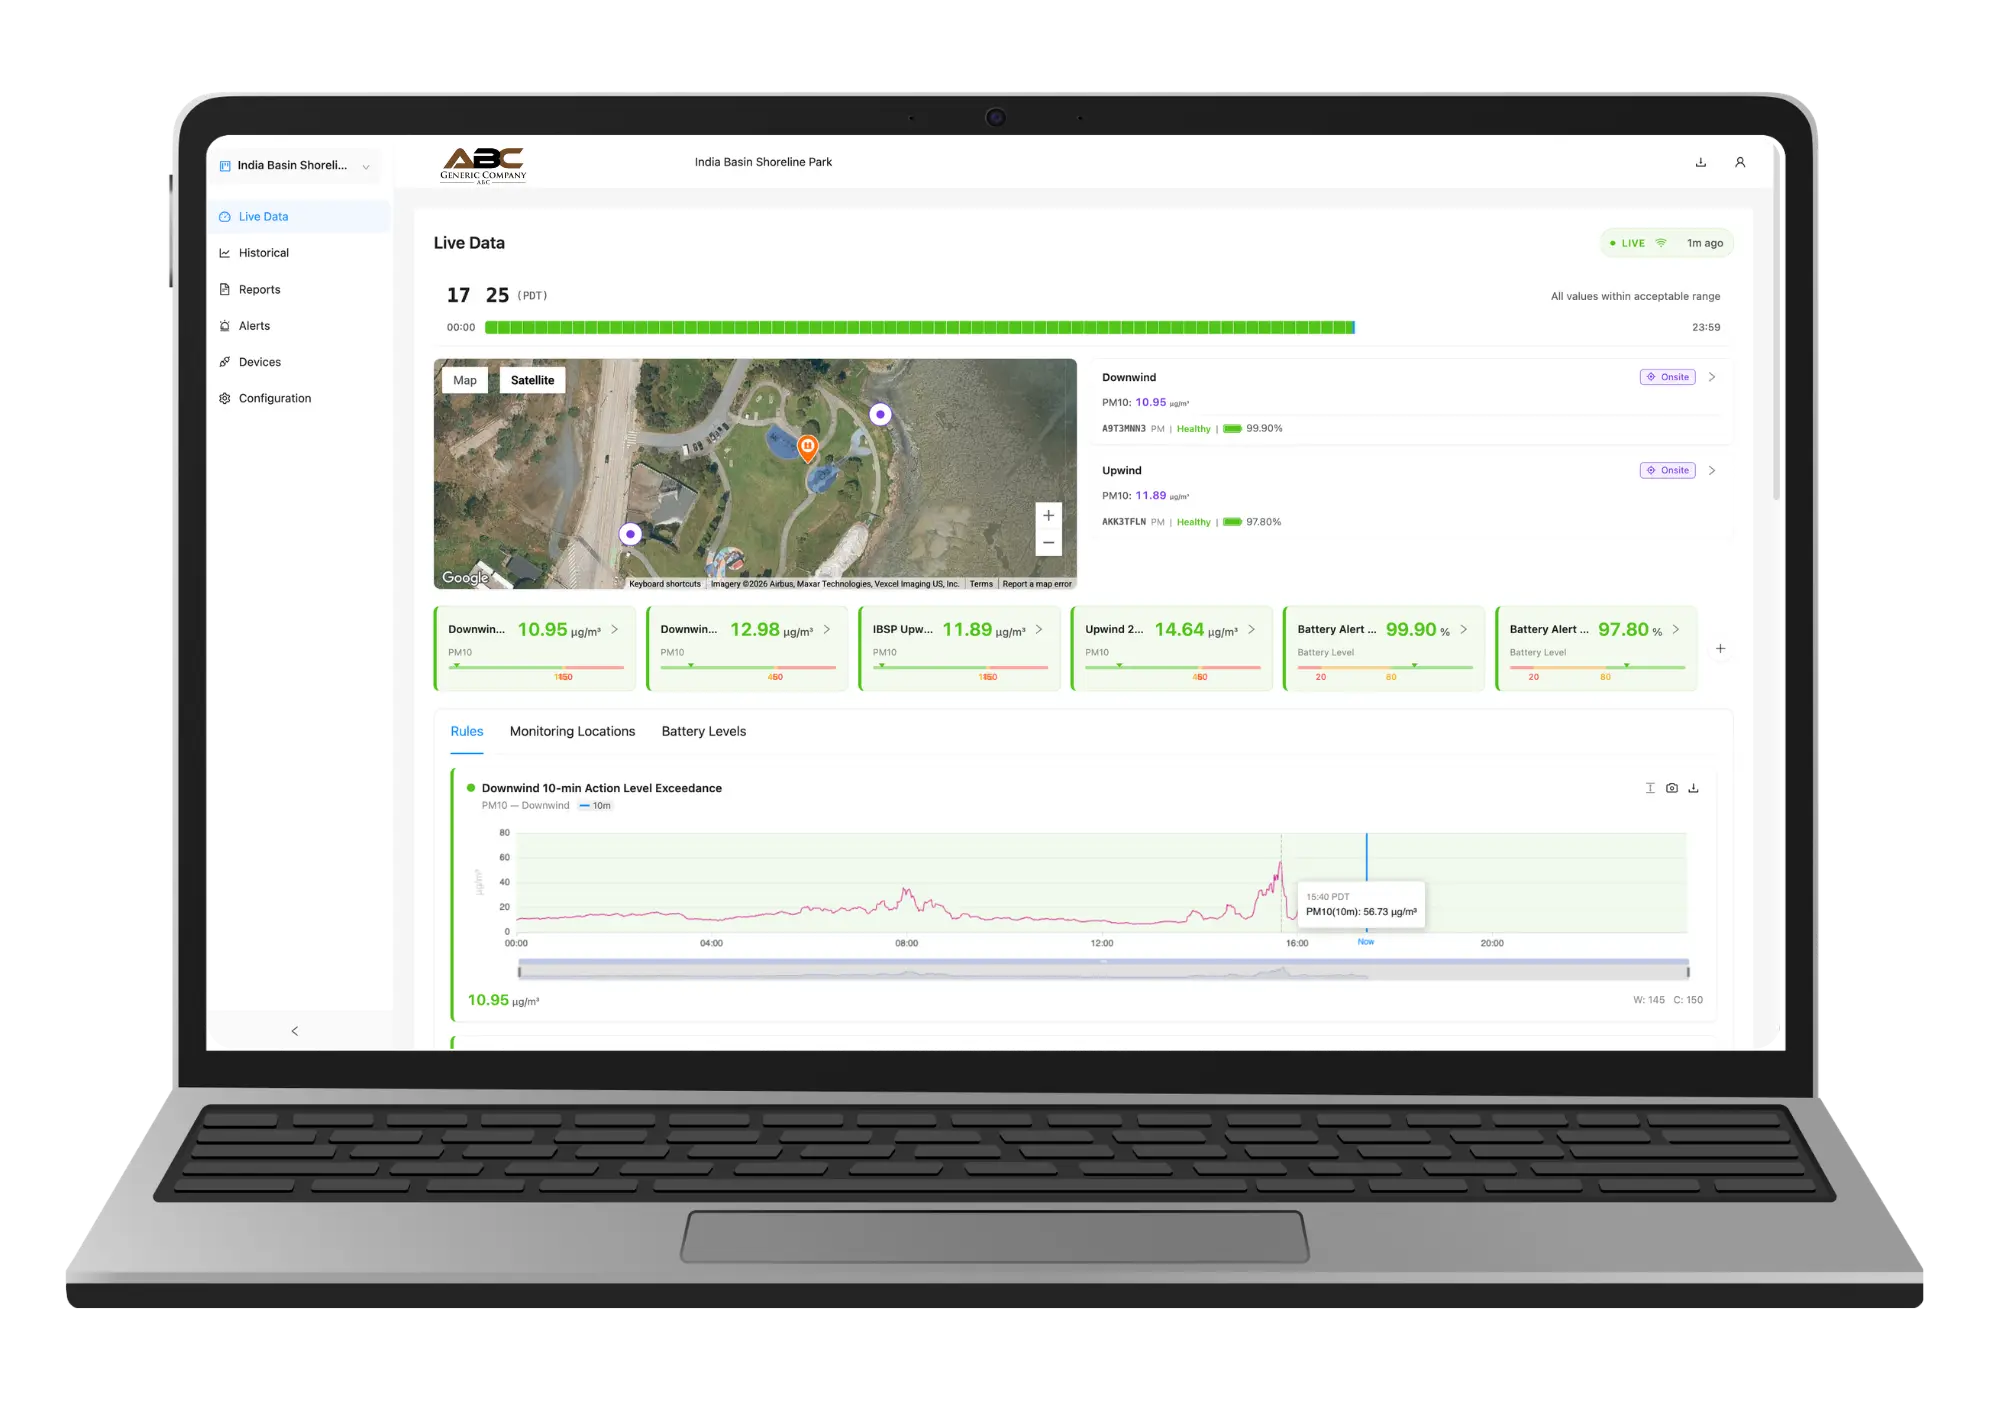
The construction dust dashboard: live PM10 by monitor, upwind and downwind tags, and the day's exceedance timeline.
Construction dust dashboard
The construction view of the Clarity Dashboard shows what a site team needs at a glance: live PM10 for every monitor with its wind reading, each unit tagged upwind or downwind so you can see at once whether a spike is yours, and a timeline of the day that turns green when there has been no exceedance. Alerts sit at the top until someone resolves or archives them, so nothing gets lost in an inbox.
Set 10-minute and 24-hour rolling-average thresholds to match the dust management plan.
Email and SMS to the site manager, the consultant, and the client, with a record of who resolved what.
Battery, connectivity, and sensor status for each unit, so a quiet monitor is never mistaken for clean air.
Download the monitoring record for permit reporting, or pull it into your own systems through the Clarity API.
Equipment
Start with the Node-S and the Dust Module, then add what your dust management plan calls for.

Measures PM10 directly with enhanced optics for coarse particles and a heated inlet that dries the sample in damp weather. The only low-cost sensor MCERTS-certified for elevated dust, with a PM10 performance range of 0 to 374 µg/m³. Connects to the Node-S and runs on an external power system, with a solar option for sites without mains power.
Learn more
The solar-powered, cellular or satellite-connected base unit that powers and connects the Dust Module. Measures PM2.5 and NO₂ in its own right, holds its own MCERTS certificate, and mounts on hoarding or a pole in minutes.
Learn more
Wind speed and direction alongside every dust reading, so you can show whether a spike came from the works or from the road behind them.
Learn moreTell us about the site and we will size the network around your dust risk assessment.
Why Clarity
The Dust Module was certified on field data with hourly PM10 up to 374 µg/m³, where ordinary low-cost sensors under-read.
Solar power and cellular or satellite connectivity mean a monitor goes on the hoarding the day the fence goes up.
Site-specific action levels send email and SMS to the site manager, not to an inbox nobody reads.
A subscription, not a purchase: when the job ends, the monitors go to the next site.
Upwind and downwind placement plus the Wind Module show what the site did and did not emit.
Exportable, time-stamped records and public sharing through OpenMap when transparency helps the project.
Construction dust monitoring is the continuous measurement of coarse particulate matter (PM₁₀) at the boundary of a construction or demolition site, with alerts when readings cross a set action level. It is required when a planning condition, a permit, or a dust management plan says so, which is common for medium and high-risk sites near homes, schools, and hospitals, and in cities such as London and San Francisco that regulate dust from demolition and earthworks. Even where it is not required, a monitoring record is the quickest way to answer a neighbour's complaint, because it shows what the site emitted, when, and whether the controls worked.
Mostly coarse dust, with diesel exhaust close behind. Demolition, earthworks, cutting, and trackout from vehicle wheels release PM₁₀, the fraction that settles on cars and windowsills and triggers complaints. Diesel plant and non-road mobile machinery add fine particulate matter (PM₂.₅), nitrogen dioxide (NO₂), black carbon, and carbon monoxide (CO), which travel further and matter more for long-term health. A Clarity network covers all of them from one platform: the Dust Module measures PM₁₀ with near-reference accuracy, the Node-S measures PM₂.₅ and NO₂, the Black Carbon Module tracks diesel soot, and the Multi-Gas Module adds CO. Most sites start with PM₁₀ and add gases where the dust risk assessment calls for them.
By subtraction. A monitor on the upwind boundary measures the dust arriving at the site from roads, neighbouring works, and the regional background. A monitor on the downwind boundary measures that background plus whatever the site added. When the downwind reading rises and the upwind reading does not, the site is the source; when both rise together, it is not. The Wind Module records speed and direction alongside every reading, so the Clarity Dashboard tags each monitor upwind or downwind as the wind shifts during the day rather than relying on a fixed assumption. That pairing is what lets a site manager defend the site when a dust cloud on a windy afternoon came from somewhere else.
Most cannot, and that is the problem the Dust Module was built to solve. Commodity optical sensors are designed for fine particles and cannot reliably size anything above about 1 µm, so on a demolition site they under-read the coarse dust the monitoring is there to catch, and they saturate in heavy events. The Dust Module measures PM₁₀ directly with enhanced optics and a heated inlet that dries the sample in damp weather. It is MCERTS-certified with a performance range of 0 to 374 µg/m³, tested in the field against heated beta attenuation reference monitors at hourly concentrations well above typical site action levels. Indicative monitors like this do not replace reference instruments where a permit demands them, but they detect exceedances reliably and in real time, which is the job on a construction site.
It depends on where the site is and what the dust management plan says. In the UK, the Institute of Air Quality Management recommends a site action level of 190 µg/m³ of PM₁₀ as a one-hour mean. In the US, air districts and consultants commonly set a site-specific trigger above the local background, often on a 10-minute or 24-hour rolling average rather than a single hour. Whatever the number, two things matter more than the threshold itself: the alert must reach the person who can stop the dusty activity, and the record must show what happened next. The Clarity Dashboard supports site-specific action levels on 10-minute and 24-hour rolling averages, with email and SMS alerts to the site team and a log of who resolved each one.
The same day the fence goes up. Clarity monitors run on solar power with a battery and report over built-in cellular, so there is nothing to trench, no mains supply to arrange, and no site Wi-Fi to depend on. The Node-S with the Dust Module mounts on hoarding or a pole with standard brackets, and the external solar power system keeps the Dust Module running through winter light. Our team checks device health remotely, so a quiet monitor is flagged as a connectivity or battery issue rather than mistaken for clean air. When the project moves to the next phase or the next site, the monitors move with it, which suits short demolition contracts as well as multi-year builds.
Clarity prices construction dust monitoring as an annual Sensing-as-a-Service subscription rather than a hardware purchase. One fee per monitor covers the Node-S and Dust Module, solar power, cellular data, the Clarity Dashboard with alerts and exports, calibration and quality control, hardware replacement, and support. The total depends on how many boundary positions the dust risk assessment calls for, which Add-On Modules you need, and how long the works run. Because the monitors move with you, the same subscription covers the next site rather than leaving equipment in a yard between projects. Request a quote with the site boundary and programme and we will size the network and price it for you.
Resources
The certification, the guide, and the explainer behind this page.
The first indicative monitor certified at the elevated dust concentrations found on construction sites.
GuideBest practices for reducing PM10 exposure from construction activity.
ExplainerWhat coarse particulate matter is, where it comes from, and why ordinary sensors miss it.
Request a quote
Tell us about the site and a Clarity air quality expert will scope a network around your dust risk assessment, site boundary, and programme. We reply within one business day.
Prefer to talk? Talk to an air quality expert
Other use cases
IAQM action levels, MCERTS, planning conditions, and dust management plans.
MiningFenceline dust from blasting, haul roads, and stockpiles.
Data centersGenerator emissions and construction-phase dust around hyperscale campuses.