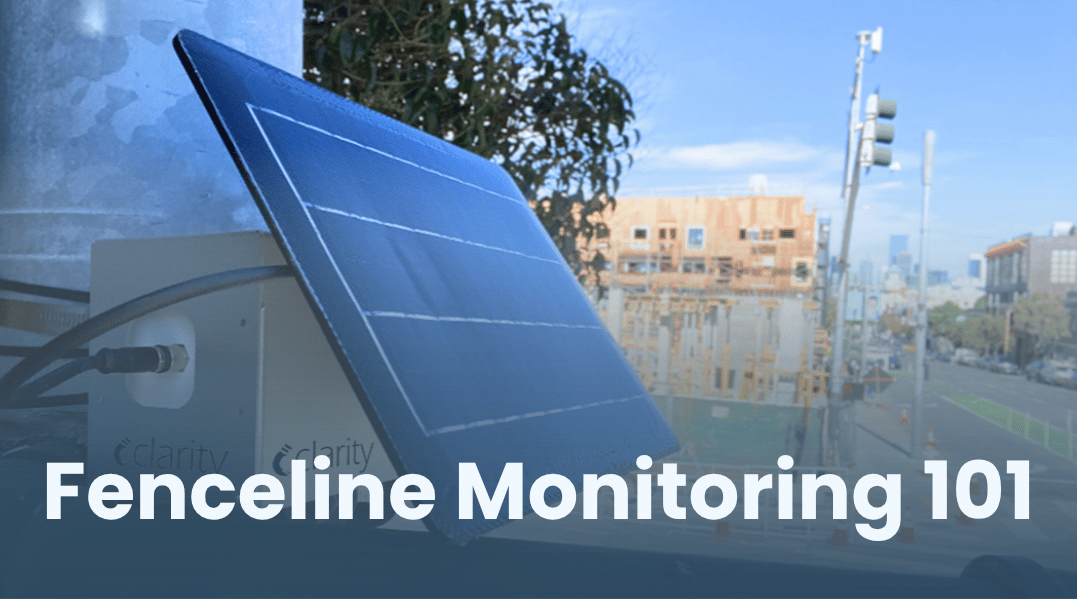
TL;DR: Fugitive emissions from refineries, petrochemical plants, construction zones, mines, and other industrial sites carry real costs for nearby communities and company reputations. Fenceline monitoring addresses this by detecting pollutants such as VOCs, sulfur dioxide, and particulate matter at a site's boundary, then turning that data into compliance reporting and public transparency.
What is fenceline monitoring?
Fenceline monitoring consists of ambient air quality monitoring set up around the fenceline or perimeter of a manufacturing site. Fenceline monitoring aims to detect leaks or fugitive emissions that may escape from industrial facilities, energy production sites, refineries, and natural gas pipelines. Fugitive emissions can harm workers, nearby communities, and the environment, as well as increase operating costs for companies. Detecting these emissions can mitigate these various impacts.
Sometimes, fenceline monitoring is required by the local government or the EPA. This is especially true for industrial facilities that handle dangerous chemicals and air toxics. Fenceline monitoring can help the EPA enforce the air quality standards under the Clean Air Act.
Why fenceline monitoring matters for industrial sites
There are many reasons why fenceline air monitoring matters for industrial sites, including:
- Protecting the local community from fugitive emissions
- Protecting the environment from fugitive emissions
- Protecting industrial workers from fugitive emissions
- Financial incentive to discover and mitigate fugitive emissions
- Supporting environmental justice
- Regulatory pressure from state or federal governments
- Building a trustworthy company reputation
Fenceline monitoring and environmental justice
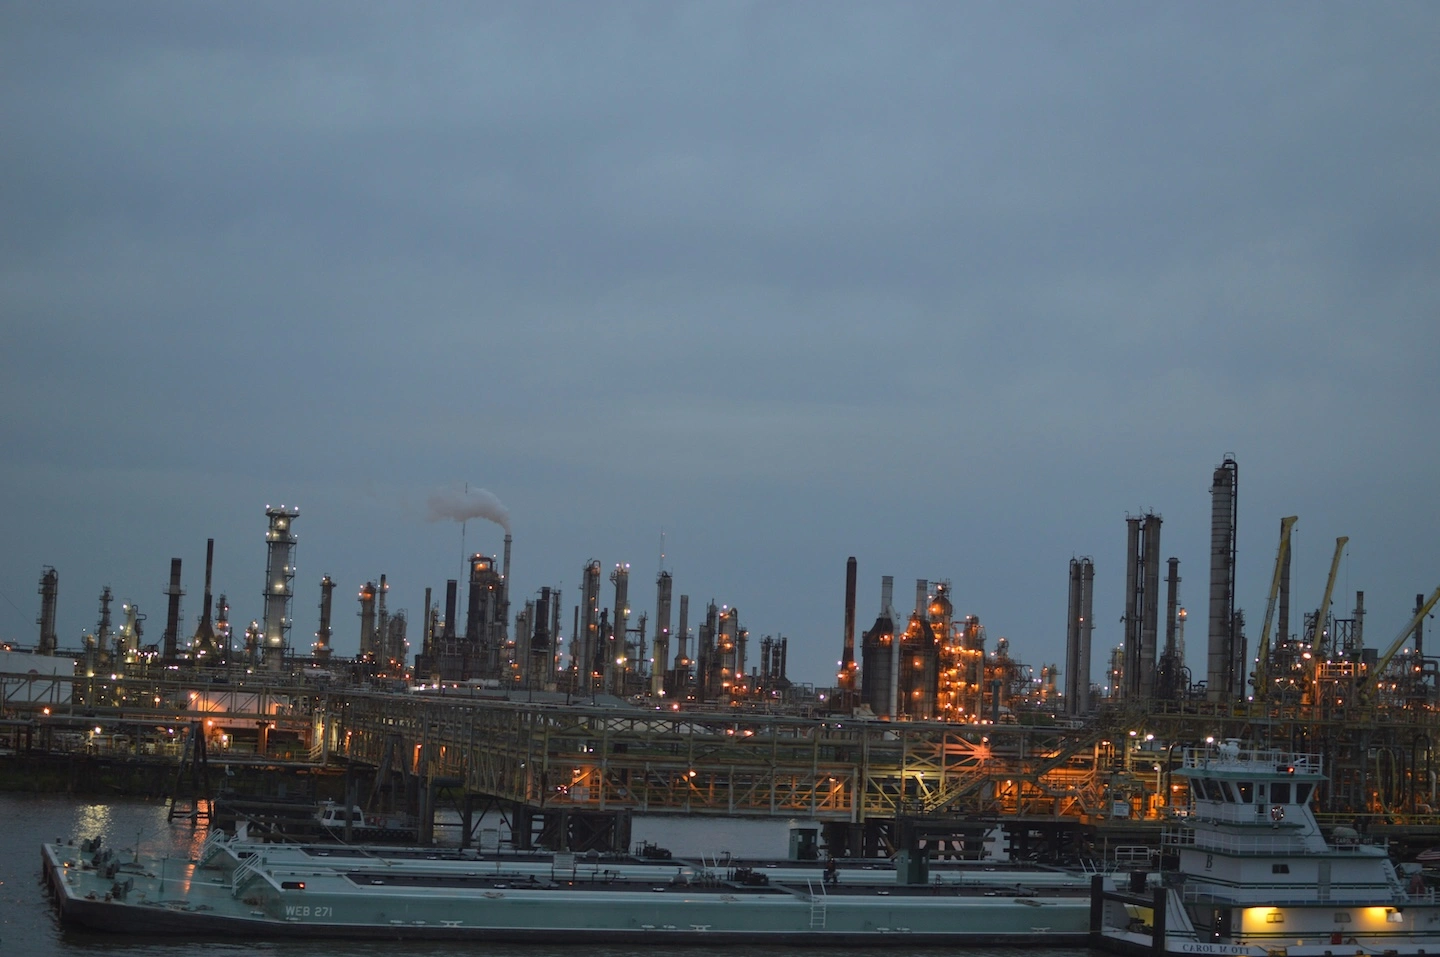
The oil and gas industry emits 9 million tons of methane and toxic pollutants like benzene into the air annually. Fenceline communities, those living near industrial plants in areas sometimes referred to as “sacrifice zones,” often face increased cancer risk due to their exposure to toxics from petrochemical, oil, and gas plants.
Historically underserved populations disproportionately live in close proximity to dangerous industrial facilities, bearing the brunt of these emissions. The EPA describes RMP facilities as those that “use extremely hazardous substances above regulated thresholds”. Roughly 131 million people live within three miles of RMP facilities. Of this number, about 44 million earn less than or equal to twice the poverty level, 20 million are African American, and 32 million are Hispanic or Latino.
What does fenceline monitoring measure?
Fenceline monitoring is used to measure a variety of harmful air pollutants, including:
- Volatile organic compounds (VOCs), such as benzene, toluene, ethylbenzene, and xylene
- Sulfur dioxide (SO2)
- Hydrogen sulfide (H2S)
- Hazardous air pollutants (HAPs), many of which are also VOCs
- Particulate Matter (PM), particularly PM10 or dust
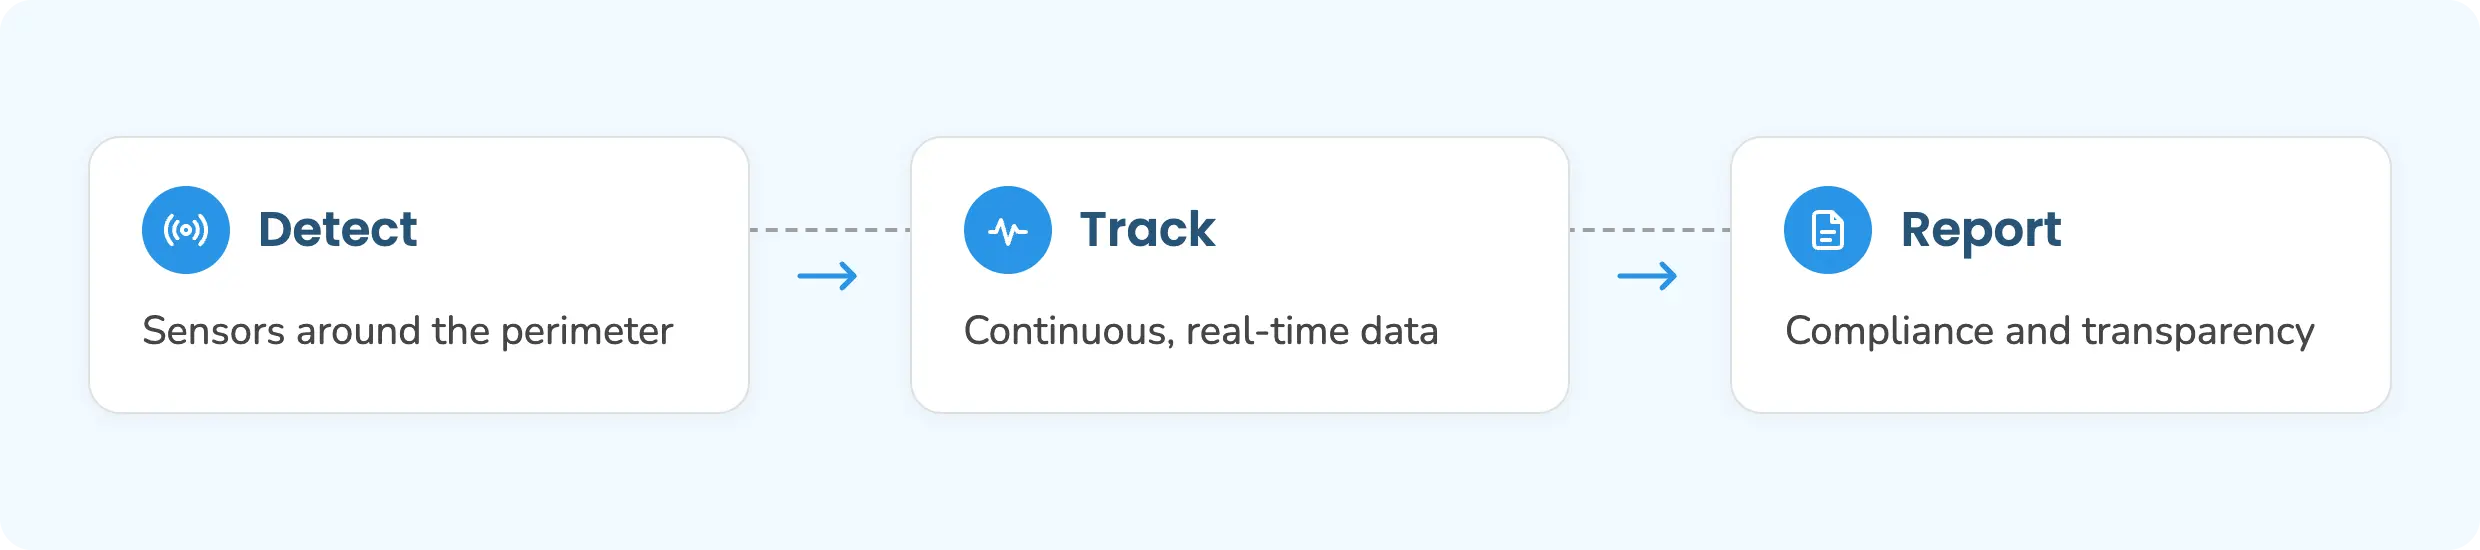
How fenceline monitoring works: Detect, track, report
The key phases of fenceline monitoring consist of sensor placement, continuous data collection, and data impact.
Detect: Sensors around the perimeter
When implementing fenceline air monitoring, many factors must be considered regarding sensor placement. Sensors should be placed in areas that are most likely to detect fugitive emissions and where nearby residents may be most vulnerable. Local meteorological conditions, topography, and potential pollutant hotspots should all be taken into account. Project managers should aim to provide adequate spatial coverage of the perimeter area.
Track: Continuous, real-time data
Continuous fenceline monitoring enables rapid detection and reporting of hazardous emissions from industrial sites, allowing for early intervention. Real-time data ensures safer communities and workers and enables quick identification of pollutant hotspots. Clarity’s monitoring offers accurate, real-time air quality solutions.
Report: Compliance and transparency
Once air quality data has been collected, it can be translated into real impact. Perimeter air monitoring data not only helps industries comply with regulatory requirements but also provides important safety information to the public and promotes company transparency. The Clarity Dashboard allows companies to easily manage and understand their air quality data, while the Clarity OpenMap enables project managers to share this data clearly with the public.
Who uses fenceline monitoring?
Many different industries deploy fenceline monitoring systems. Some need to do so for regulatory compliance, while others do so voluntarily to show transparency and help protect the community. Below are just a few examples of industries that implement fenceline monitoring.
Real-world examples: Fenceline monitoring in practice
Clarity has effectively supported fenceline and industrial air quality monitoring across several sectors.
Yerevan, Armenia
In 2022, Yerevan’s City Council (Council of Elders) passed a mandate requiring that air quality monitoring devices be installed at construction sites to curb dust emissions. Today, each major construction site in Yerevan is equipped with at least two Node-S air quality sensors, creating a network of roughly 170 sensors across the city.
Clarity’s Node-S sensors are solar-powered and wireless, making them ideal for construction sites that may not have external power sources. Our user-friendly software and API integration made it easy to share Yerevan’s air pollution data and alerts with the appropriate inspectors, urban planners, and even construction contractors.
After the installation of the equipment, public discussions about air pollution intensified. This led to new regulations and stricter administration, especially in the construction sector.”
— Sargis Manukyan, Director of the Technology Management Center of Yerevan City
First Quantum Minerals
First Quantum Minerals is a global copper company that operates long-life mines in multiple countries. Kansanshi Mine in Zambia, operated by Kansanshi Mining PLC, a subsidiary of First Quantum Minerals, enhanced its air quality monitoring system by adding six Node-S air quality sensors.
Clarity’s sensors improved compliance monitoring by enhancing data accuracy, reducing costs, and improving ease of use. The new air quality data has enabled proactive community relations and company transparency.
There's less maintenance with Clarity’s compact Node-S device — remote monitoring of device health means less cost to actually go to that particular site for maintenance. That time and cost-saving measure is critical for our business.”
— Elisha Mulilo, Air Quality & Emissions Specialist, Kansanshi Mine
Modern fenceline monitoring with Clarity
Fenceline monitoring is important for both compliance and community safety. Clarity’s sensors are self-sufficient, low-maintenance, and provide near reference-grade accuracy. They support real-time air quality data, making them the ideal option for fenceline monitoring. Partner with Clarity to support clean air.