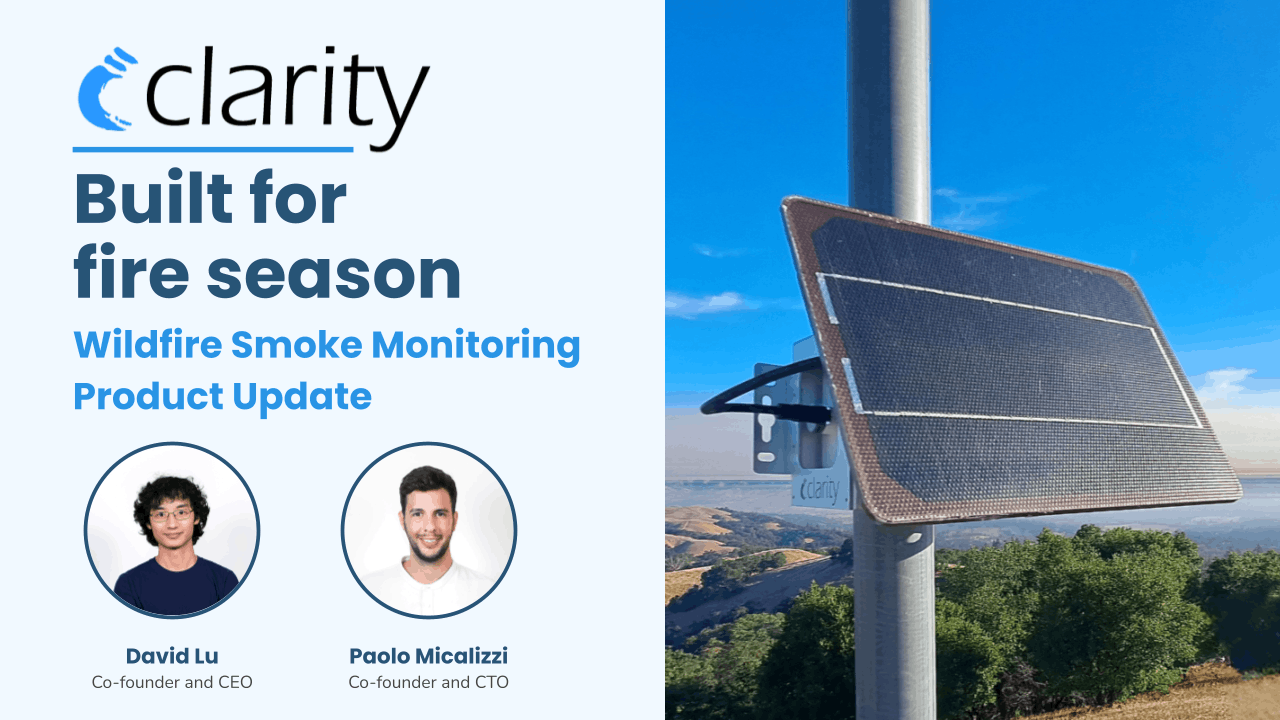
TL;DR: Clarity CEO David Lu and Clarity CTO Paulo Micalizzi discuss four new features that address common gaps in wildfire smoke monitoring: lost connectivity, sensors maxing out in dense smoke, complicated data management, and limited public access to air quality information. Satellite fallback and extended carbon monoxide range are available for pilots now and launch in early 2027, while the redesigned Dashboard and new OpenMap capabilities, such as the smoke layer, are already live.
Watch the full webinar here:
Wildfire Smoke is a national crisis
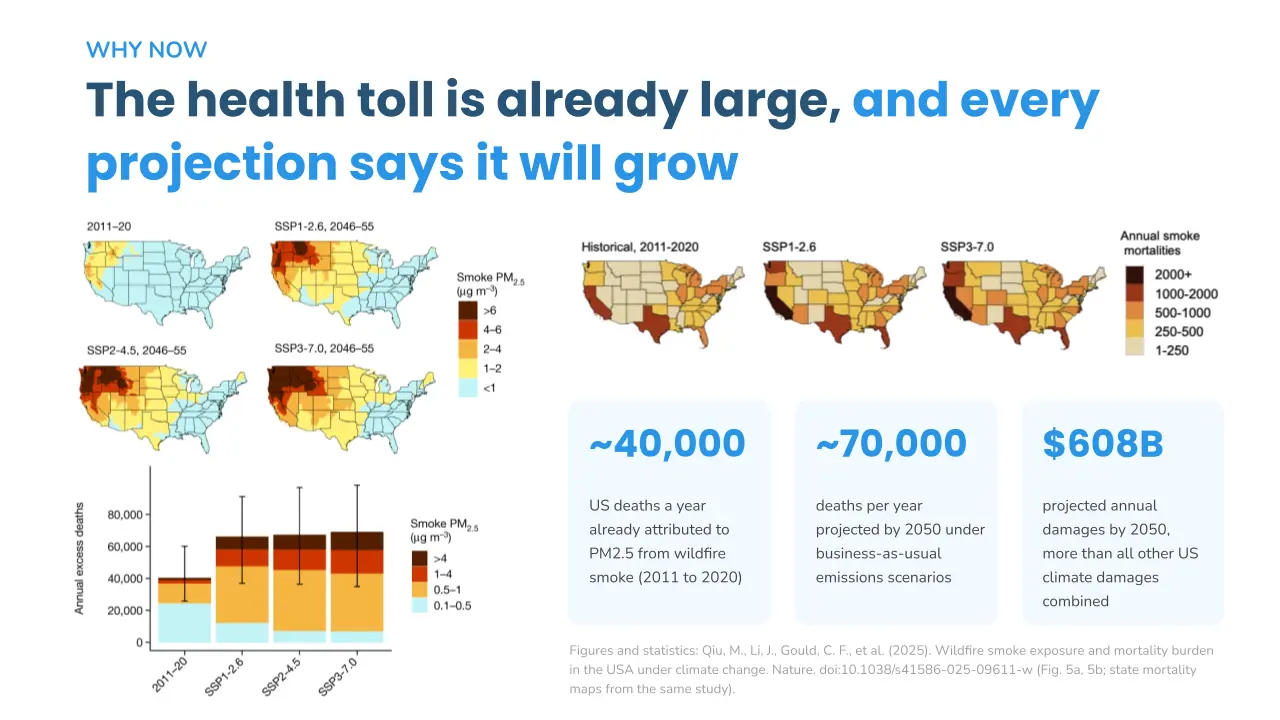
Wildfires are growing more frequent and intense in many areas due to climate change. Wildfire smoke already takes a heavy health toll. About 40,000 deaths per year are linked to fine particulate matter (PM2.5) from wildfire smoke. In a business-as-usual scenario, about 70,000 deaths per year are projected by 2050.
Our Product Offerings
Clarity Movement currently offers many products that assist with wildfire smoke management. Our flagship Node-S air pollution sensor measures fine particulate matter (PM2.5) and nitrogen dioxide (NO2). It is solar-powered, UV- and weather-resistant, easy to install, and uses cellular connectivity for remote deployment. The Node-S is the only professional-grade sensor on the EPA Fire and Smoke Map, and it is calibrated for accurate wildfire smoke measurement.
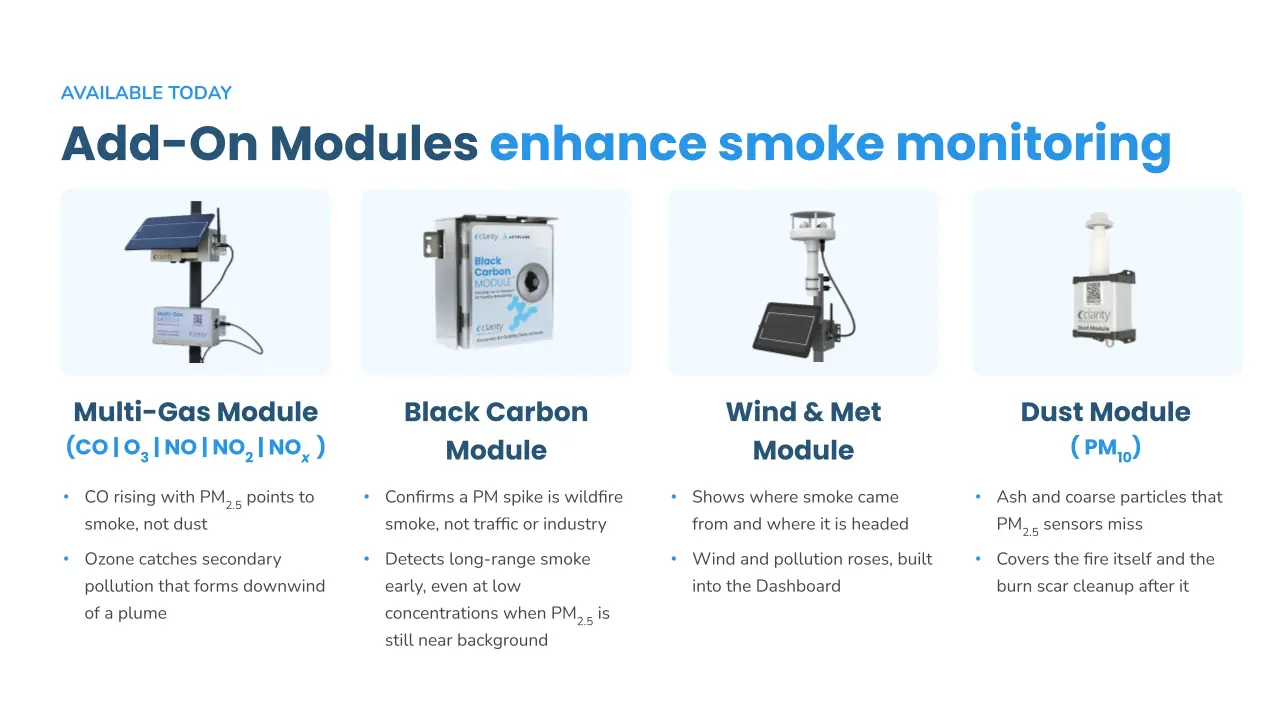
We also offer several Add-On Modules for enhanced smoke monitoring. For instance, our Multi-Gas Module measures carbon monoxide (CO), ozone (O3), nitric oxide (NO), nitrogen dioxide (NO2), and nitrogen oxides (NOx). Our Black Carbon Module has source apportionment to distinguish wildfire pollution from other emissions.
New Clarity product features for wildfire smoke monitoring
In addition to our current offerings, Clarity is adding four new product features to improve smoke monitoring. These features include enhanced coverage, extended measurement range, simplified management and analysis, and expanded public data sharing.
Enhanced coverage with direct-to-cell satellite connectivity
Although the Node-S already has solar power and cellular connectivity to monitor in remote areas, sometimes power drops, cell service failures, and cell service gaps inhibit real-time air quality monitoring during wildfire events.
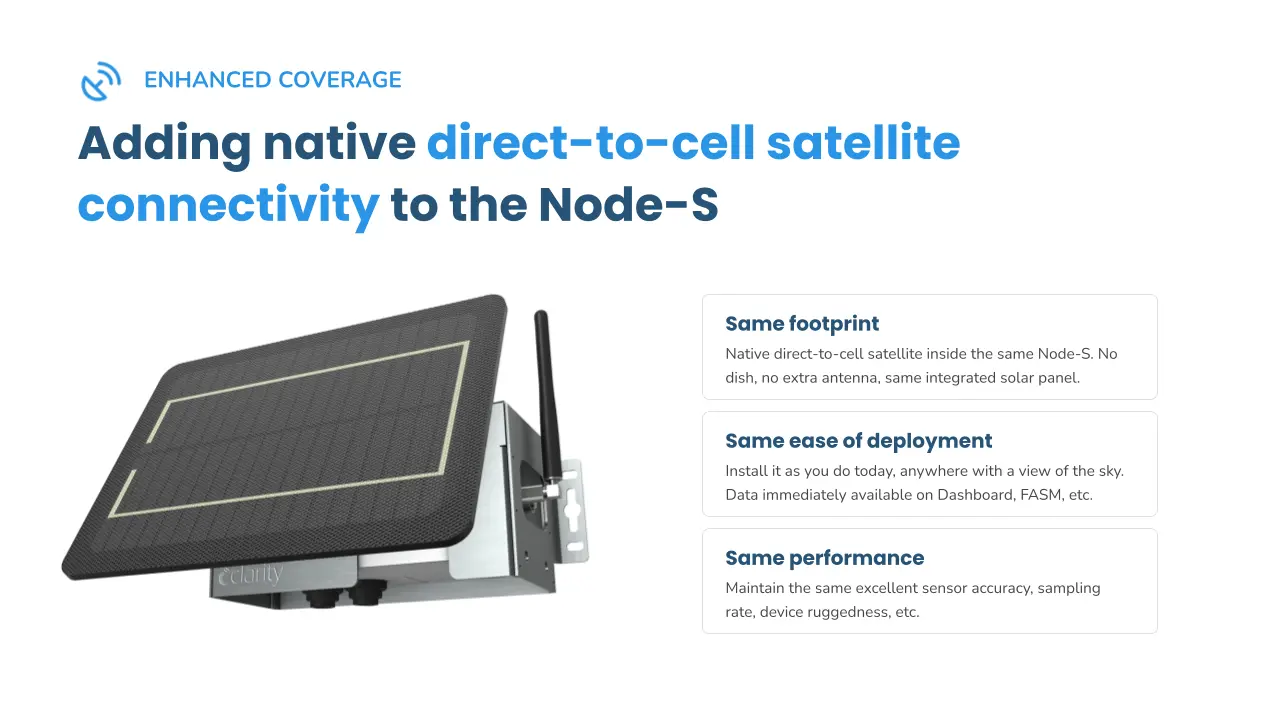
For this reason, Clarity is adding native direct-to-cell satellite connectivity to the Node-S. This means that if the Node-S loses access to the cell network, it will fall back on satellite connectivity to relay live measurements to the cloud and Clarity Dashboard in real time.
This new feature will be launching in the United States first and then rolled out globally over time. Currently, it is available for pilots and will be officially launched in early 2027.
Extended carbon monoxide measurement range
The second improvement that our engineers are working on is an extended measurement range for our Multi-Gas Module. We are extending this module’s carbon monoxide measurement range to up to 500 parts per million. This would allow the module to be exposed to much more intense wildfire smoke without maxing out, aiding both emergency responders and public safety decision-making.
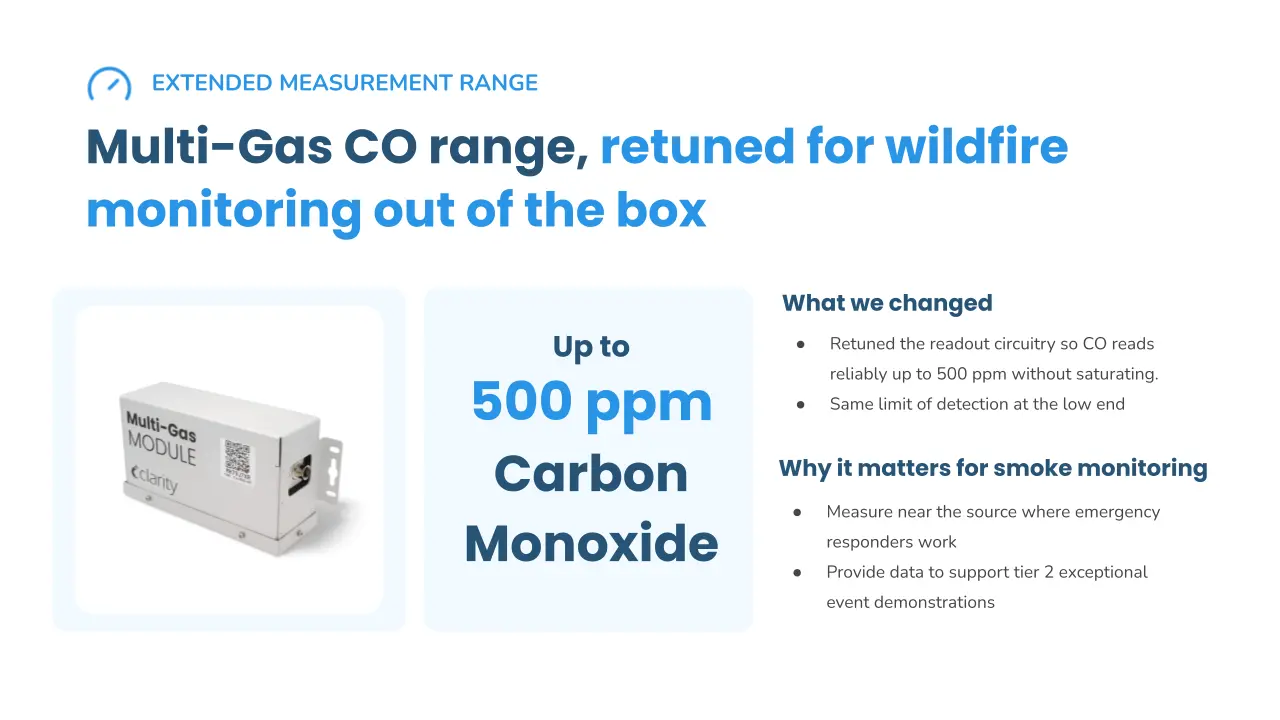
The Multi-Gas elevated carbon monoxide range is now available for pilots and will be shipping in early 2027.
Simplified network management and data analysis with Clarity Dashboard
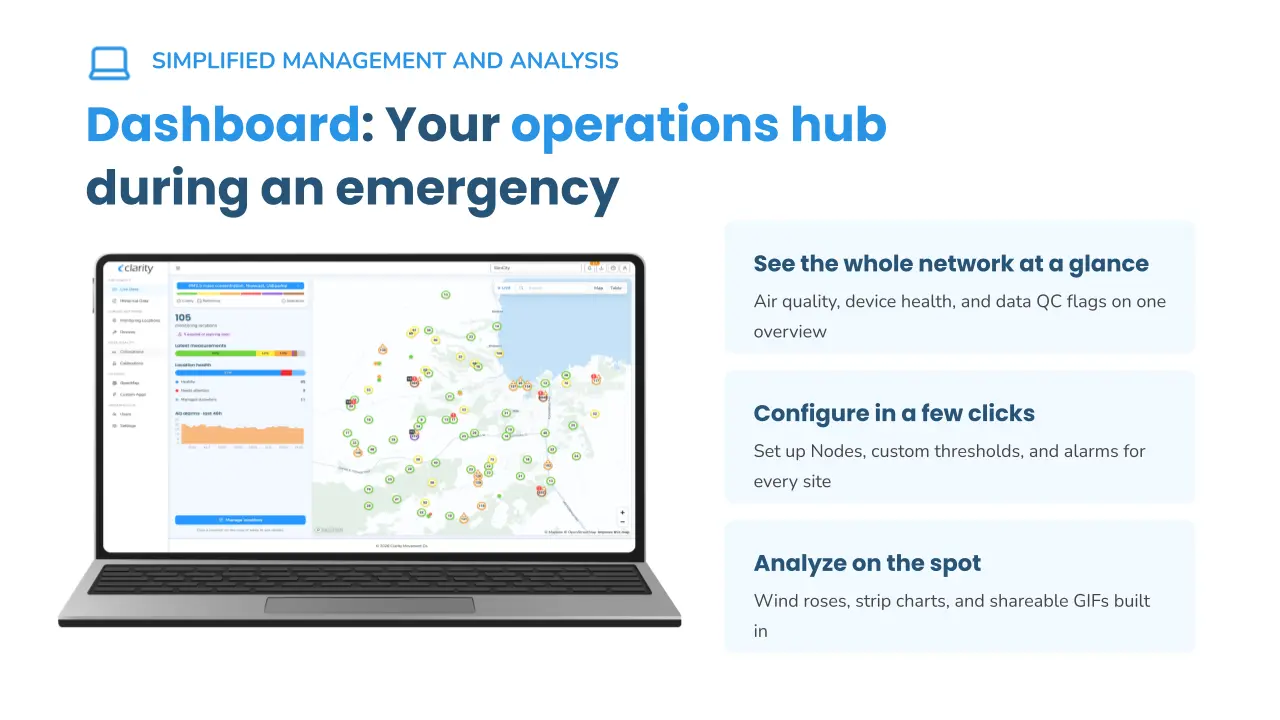
This new feature was released a few weeks ago in the form of our full refresh and remake of our Clarity Dashboard. The Clarity Dashboard is where you can interact with the monitoring data and telemetry from your air quality sensor network. There have been many improvements to the dashboard, including many that support wildfire smoke monitoring, such as:
- It is now easier to track both live air pollution conditions and device health
- It now comes with an A.I. powered device diagnosis feature
- It is now easier to customize alarms and notifications for pollution thresholds
- It now comes with advanced analysis that you can effortlessly copy, paste, and export
Expanded public data sharing with OpenMap
In addition to improving access to live data, Clarity is now making it easier for communities to stay informed during wildfires by expanding our public data sharing capabilities.
With Clarity, you are always the full owner of your air quality data. You choose whether or not to keep your air quality data private. However, if you choose to make your data publicly available, it will be displayed on the Clarity OpenMap. This is a simplified interactive map for citizens and communities to intuitively view and understand real-time air quality data. The Clarity OpenMap’s public data sharing is included with our Sensing-as-a-Service model.
The Clarity OpenMap comes in the form of a widget that you can easily embed into your organization’s website from the Clarity Dashboard. The OpenMap can also be white-labeled, meaning that you can put your own logo, messaging, and advisories onto it.
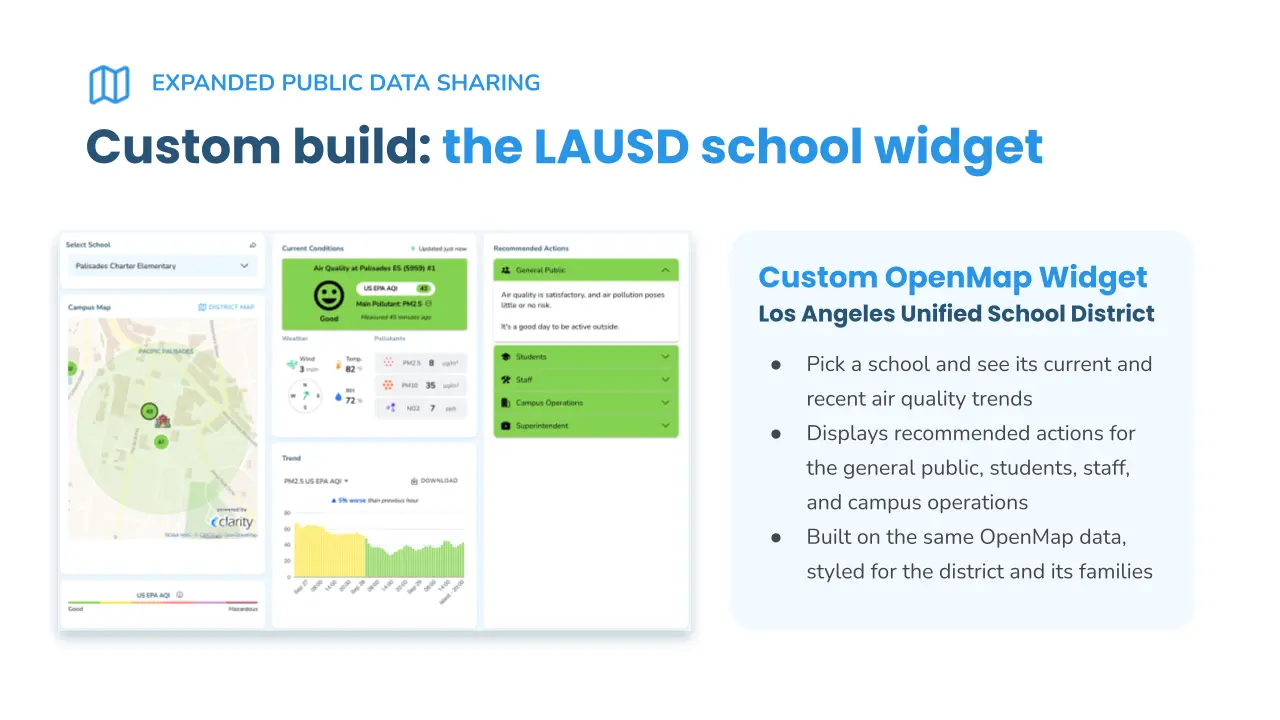
As of today, our customers can also build a customized Dashboard with us for citizens to interact with. We have already done some similar work with the Los Angeles Unified School District. Together, we built a custom dashboard displayed at schools and on their website that allows parents and students to find nearby monitoring locations to schools, observe current air quality conditions, explore some past air pollution data, and see tailored recommendations.
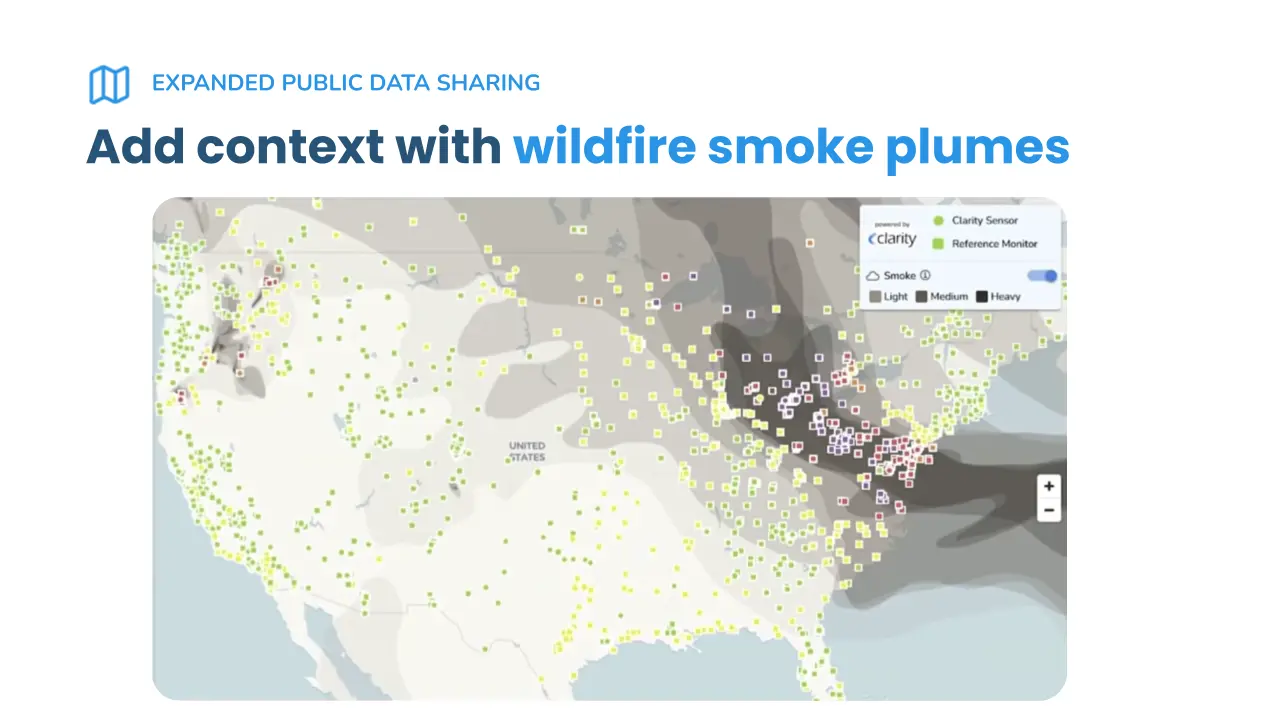
Lastly, Clarity recently added a smoke layer to our OpenMap to help users visualize and contextualize any elevated AQI colors resulting from a smoke plume.
Improving wildfire smoke monitoring with Clarity
We thank those on the front lines of wildfire and wildfire smoke response efforts, who help keep us and our communities safe. We hope our new product offerings help make wildfire response a little bit easier. Partner with Clarity to learn more about our wildfire monitoring options and help support clean air for all.