TL;DR: Across the country this Fourth of July, Clarity's air quality sensors captured a dramatic, if temporary, spike in fine particulate pollution from fireworks. Readings at eight locations climbed into “Unhealthy” to “Hazardous” territory before clearing within a day or two. The data, drawn only from Clarity Node-S air pollution sensor networks that have opted to share their readings publicly, illustrates the scale of firework-related pollution. Hyperlocal air quality monitoring helps communities understand and mitigate these annual spikes.
Fourth of July Fireworks air pollution emissions
Fourth of July fireworks are stunning and enjoyable, but come with a drawback: air pollution emissions. Every July, fireworks pollution events occur across the country, which Clarity Movement’s networks of outdoor air quality sensors track in real time.
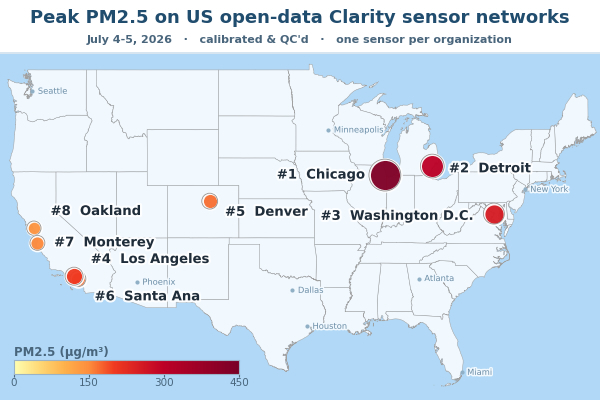
Here, we’ve identified the eight highest calibrated hourly PM2.5 mass concentration readings on Clarity sensors within the United States over July 4th and July 5th. Peak measurements hit “hazardous” levels of fine particulate matter (>250 µg/m³) in major cities across the country.
A note on open data & privacy
The readings included here come only from sensors that our clients have chosen to configure for open data sharing, opting in to our OpenMap and/or Open Data API. Our customers fully own their data, and Clarity does not co-own the data. See Clarity’s Data Promise here for more.
The highest 4th of July Clarity sensor readings
The readings below show the eight highest PM2.5 Clarity sensor hourly readings over July 4th and July 5th. The readings are calibrated and quality controlled. They show one sensor per organization, report PM2.5 mass concentration as peak hourly values, and are ranked here from lowest to highest.
Want to see how fireworks-related pollution plays out in the data? We built an interactive data story that walks through how air pollution built up, spread, and faded across Washington, D.C. during the Freedom 250 celebrations. As you scroll, you can watch PM2.5 climb across the network into the EPA's "Unhealthy" range, see which neighborhoods were hit hardest, and follow the smoke as it moved well beyond the National Mall. Read the full data story here!
#8 Oakland, California – 141.8 µg/m³
A Clarity sensor located at East Oakland Pride Elementary School recorded peak particulate matter readings of 141.8 µg/m³ at roughly 10 pm local time on July 4th.

The sensor is part of the Sequoia Foundation’s Air Aware Oakland network. The Sequoia Foundation is a public-health nonprofit running a school-based community air quality monitoring program. The network comprises nearly 70 Clarity Node-S air quality sensors across school campuses.
#7 Seaside, California – 152.4 µg/m³
A Node-S air quality sensor located at Manzanita Elementary School peaked at around 9 pm local time on July 4th, recording readings of 152.4µg/m³.

This sensor is a part of the network run by Monterey Bay Air Resources District (MBARD), a regional air quality regulatory agency that covers Monterey, Santa Cruz, and San Benito counties. MBARD’s network has more than 25 Clarity sensors, which help protect public health, especially with the wildfires that regularly plague the region.
#6 Santa Ana, California – 166.3 µg/m³
An air quality sensor located at Century High School, which is in Santa Ana, California, found peak measurements of 166.3 µg/m³ at roughly 10 pm local time.

This sensor is run by the Madison Park Neighborhood Association, which manages a smaller network of sensors deployed at local schools in the area. The Association supports local efforts and policies that enable health equity and community empowerment. They are committed to promoting safe and clean environments, in part through air quality monitoring.
#5 Commerce City, Colorado – 167.6 µg/m³
A Clarity sensor is sited at Anythink, the public library for Adams County. The library is located in Commerce City, a suburb near Denver, Colorado. At 10 pm on July 4th, the Anythink Clarity Node-S measured peak particulate matter mass concentration levels of 167.6 µg/m³.

This sensor is a part of the network run by the Colorado Local Entity Air Network (CLEAN), which is comprised of the Adams County Health Department and partners. The decently-sized network includes Clarity nodes and other sensors that collect data to improve air quality. Residents can see real-time air quality recommendations through the Love My Air program.
#4 Los Angeles, California — 203.3 µg/m³
The Node-S air quality sensor located at Weigand Elementary School saw peak particulate matter readings of 203.3µg/m³ at 9 pm, local time.

This air quality sensor is a part of the Los Angeles Unified School District (LAUSD) network, one of the largest school-based networks in the United States. It is comprised of more than 200 Node-S Clarity sensors, several of which also include our Wind Module and Dust Module. The LAUSD sensors help inform parents and protect students from poor air quality, especially amid the wildfire season.
The above interactive graphic shows air quality changes across Los Angeles during this year's Fourth of July and previous years. The data comes from the LAUSD network of Node-S Clarity air quality sensors. Each dot represents a school-based sensor colored by its US EPA NowCast Air Quality Index, and the chart below traces the network's hourly reading.
#3 Washington, DC — 252.3 µg/m³
An air quality sensor located at AppleTree School’s Southwest campus in Washington, DC, recorded peak particulate matter readings of 252.3 µg/m³ at 4 a.m. local time. The sensor captured air pollution that lingered in the air for hours after initial firework emissions.

Clarity Node-S is a part of the network run by the Washington, D.C., Department of Energy and Environment (DOEE), which consists of dozens of air quality sensors.
This network was very well-positioned to capture the 850,000 fireworks that were set off in the U.S. Capitol for the country’s 250th birthday, which caused hourly concentrations of particulate matter to rise to 6.7 times their pre-fireworks levels. Unhealthy levels of air pollution remained for several hours after the celebrations. Air quality could have been even worse if thunderstorms later in the day on Sunday had not helped dissipate lingering pollution.
This timelapse, which comes from a Clarity report, shows air quality AQI data as measured from several sensors in Washington, D.C., at 4 am on July 5th. Many different sensors reflected unhealthy or very unhealthy readings.
#2 City of Detroit, Michigan — 299.0 µg/m³
A Clarity sensor located in Northeast Detroit registered peak particulate matter readings of 299.0 µg/m³ at 10 pm, local time.

This sensor is a part of an air quality monitoring network run by the City of Detroit. There are a handful of Clarity Node-S sensors in the network, allowing citizens to view real-time and hyperlocal air quality data in Southwest Detroit.
#1 Chicago, Illinois — 433.5 µg/m³
An air quality sensor located in West Lawn, a neighborhood in Chicago, recorded peak particulate matter measurements of 433.5 µg/m³ at 9 pm local time.

This sensor is a part of the network run by the Chicago Department of Public Health, together with the UIC School of Public Health, ComEd, and other partners. Comprised of 277 air quality sensors, the Open Air Chicago network is the largest community air monitoring network in the country and the second largest in the world.
Observed fireworks air pollution patterns
Nearly all peak readings were recorded around 9 pm or 10 pm, around the time when most fireworks are being set off. Washington, DC, was the exception. DC saw emissions linger for hours after the Freedom 250 fireworks show ended, likely due to both the scale of the fireworks display and a heat dome causing low wind speeds and overall stagnant meteorological conditions. In most of the cities, emissions lingered in the air for at least a couple of hours, with some only seeing a return to relative normalcy later the next day.
Generally, particulate matter fireworks emissions clear within a day or two. Atmospheric conditions, such as wind, rain, and fog, can affect how quickly air pollution disperses. However, even short-term exposure to air pollution, especially intense spikes like those from fireworks, can be harmful, with children, the elderly, and people with preexisting conditions most at risk.
Monitoring fireworks emissions with Clarity
Hyperlocal air quality data helps identify air pollution exposure, inequalities, and hotspots, empowering communities to mitigate their health risk and environmental pollution. By making air quality data public, organizations can better protect public health. Explore public sensor data on Clarity’s OpenMap or get in touch to talk with our team about community air monitoring.