TL;DR: The RAC’s recent black carbon monitoring report reveals how traffic emissions, biomass burning, weather, and seasonal conditions shape air pollution patterns across Perth and Peel. Using Clarity’s Black Carbon Modules and Node-S sensors, the RAC found that fossil fuels were the dominant source of black carbon air pollution, with concentrations strongly linked to traffic emissions. The findings support the RAC’s efforts to better understand local air pollution and reduce traffic-related emissions to improve public health.
What is RAC?
The Royal Automobile Club (RAC) of Western Australia is an Associated Incorporation that was formed in 1905 to support the interests of car owners and the wider Western Australian community. The RAC has championed efforts to improve road safety, sustainability, and smarter, more connected travel.
The organization aims to reduce vehicle air pollution for a safer community and a healthier environment. Among other things, the RAC advocates for a reduced reliance on cars, an increase in low- and zero-emission vehicles, and effective public transportation.
Black carbon monitoring
Black carbon (BC) is a type of particulate matter that is more commonly known as soot. Black carbon is emitted by industrial activities, wildfires, wood stoves, and coal burning. Significant emissions also come from vehicle exhaust, making it a kind of traffic-related air pollution (TRAP).
Soot is especially harmful to human health. When inhaled, small black carbon particulates sneak past our bodies’ defenses, making their way deep into our lungs and even our bloodstream.
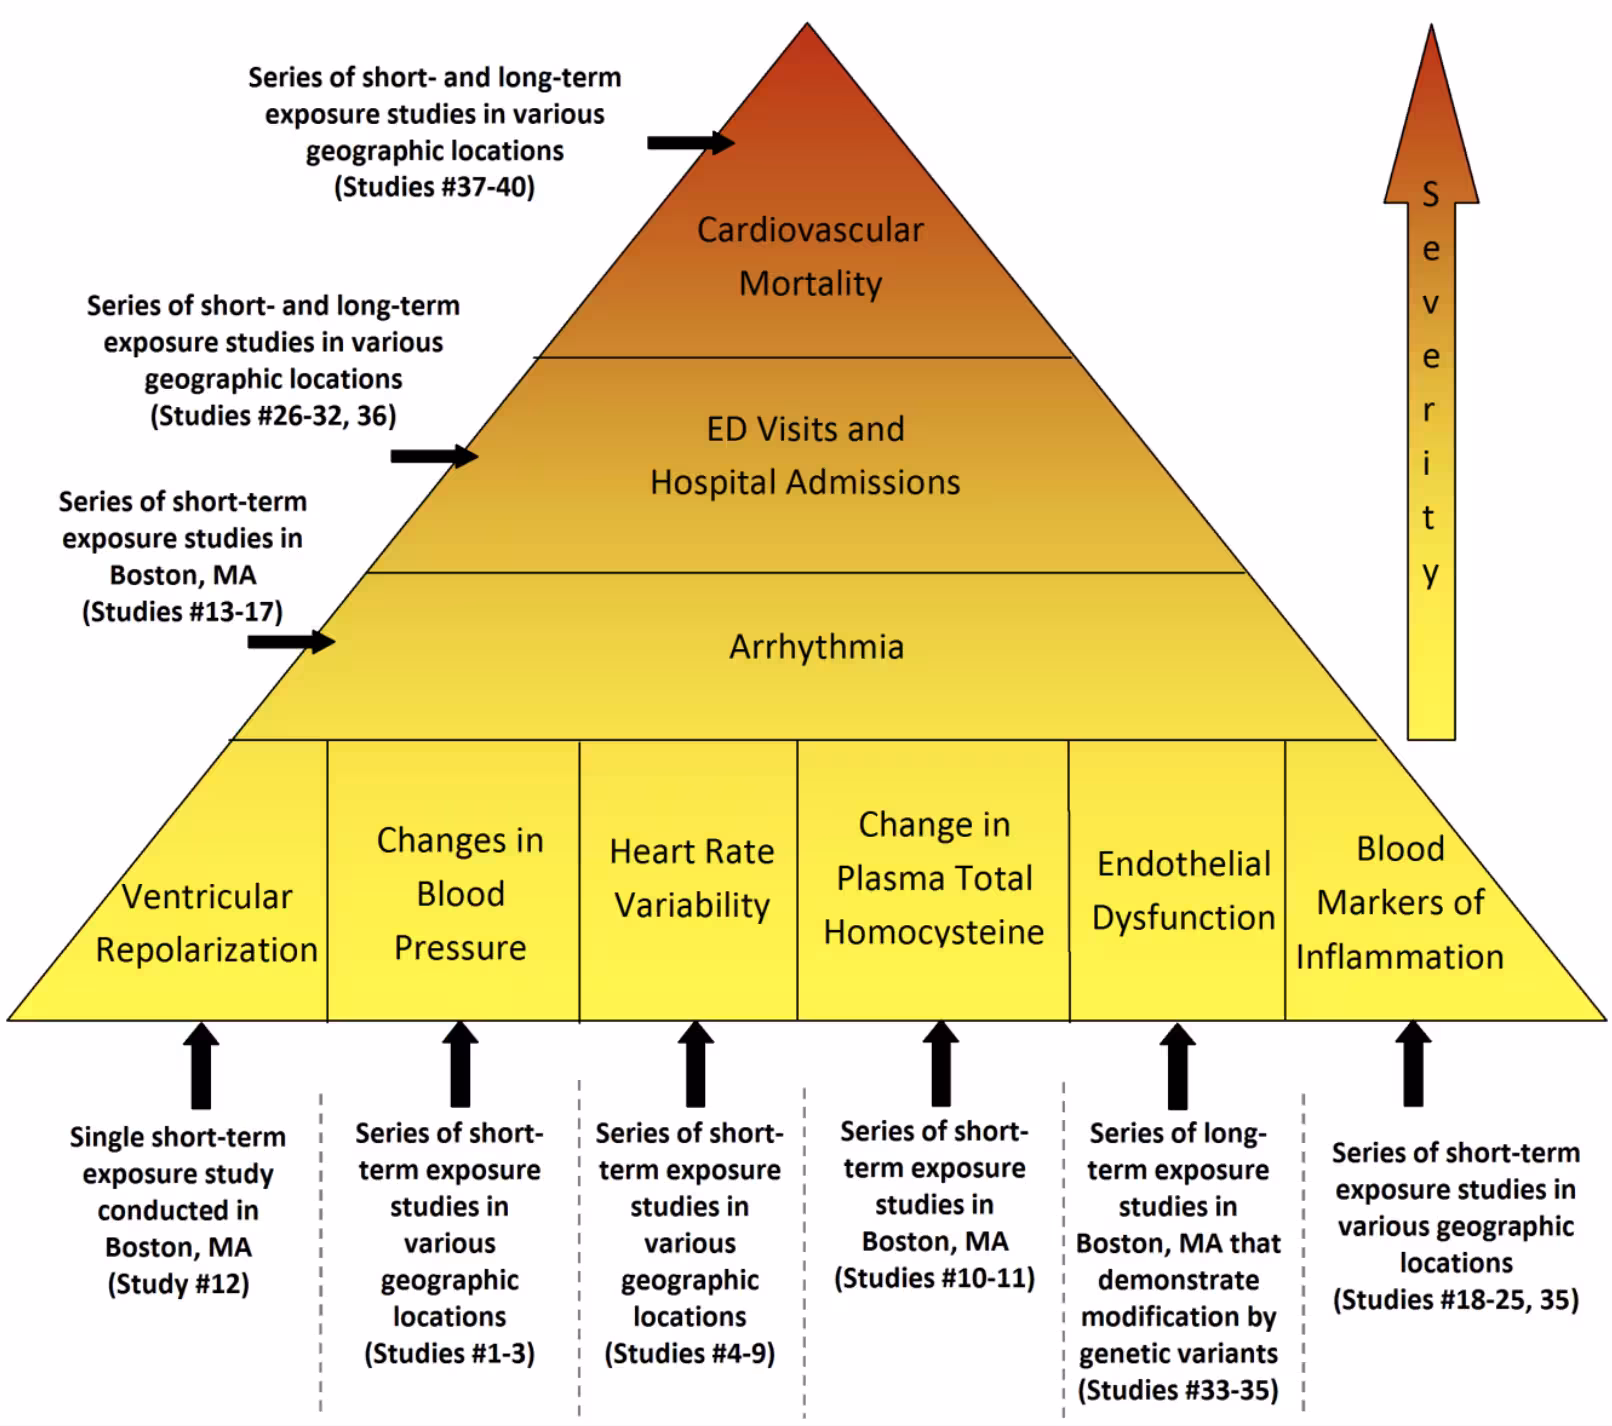
Black carbon is also a “short-lived climate pollutant,” meaning that despite its short time in the atmosphere, it can dramatically impact the climate. The dark color of soot allows it to absorb heat and light, reducing the Earth’s albedo, which is its ability to reflect solar energy back into space. This results in a warming effect that is 460 - 1,500 times stronger than CO2 per unit mass.
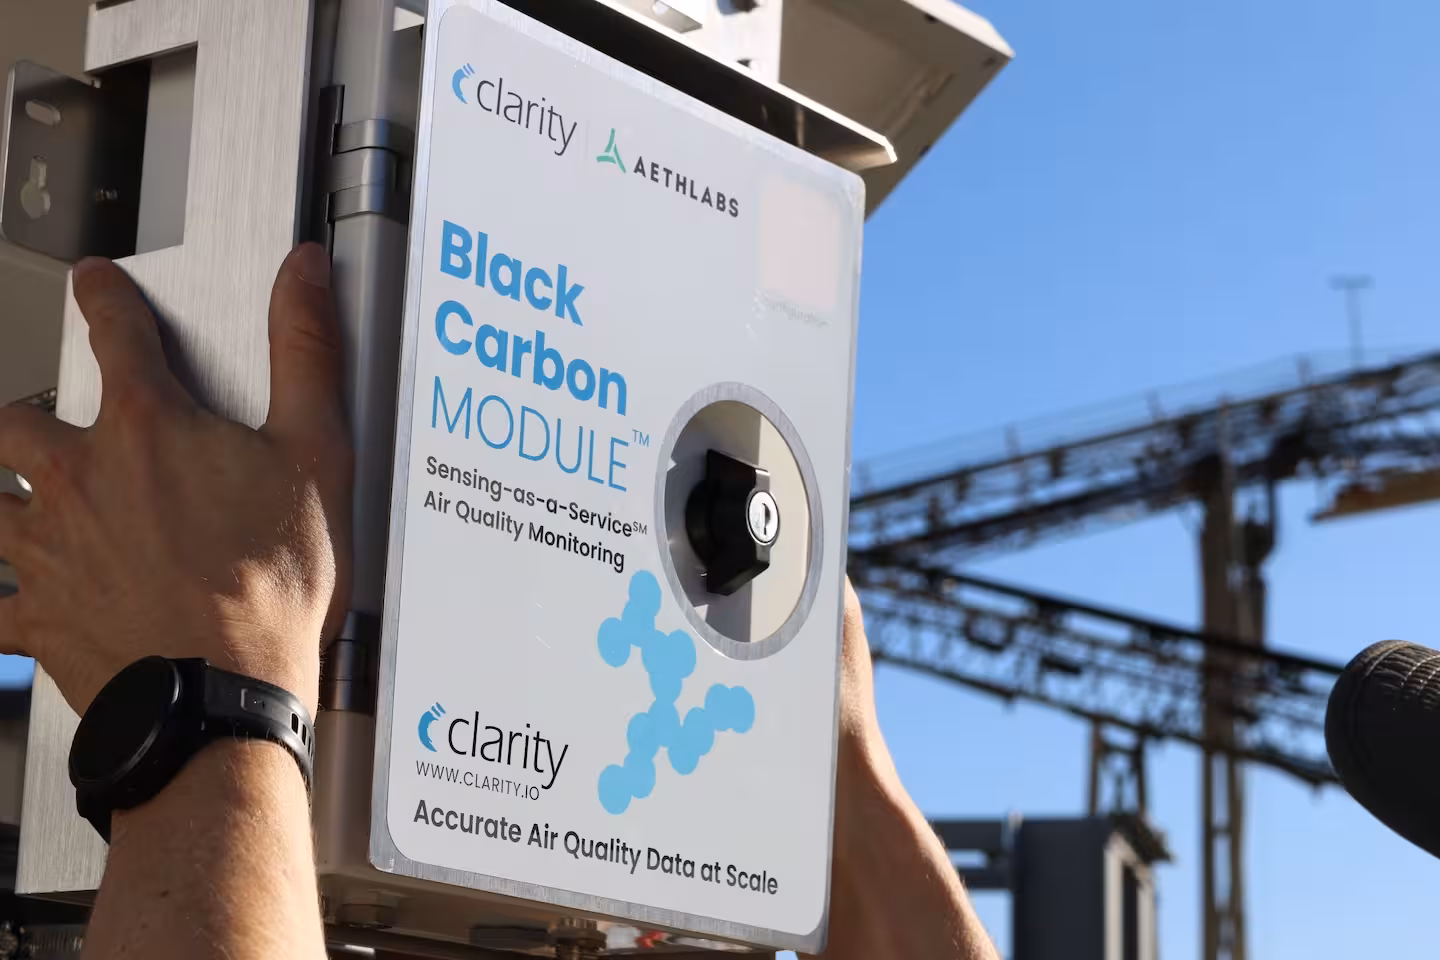
Clarity’s Black Carbon Module enables widespread soot monitoring across urban and rural environments. Clarity technology can even distinguish between emissions from fossil fuels and biomass burning. The module is solar-powered and utilizes cellular networks to transmit data, making it self-sufficient and easy to deploy. The Clarity Dashboard enables easy visualization of real-time air quality data for analysis and sensor network management.
The RAC black carbon monitoring report
In 2022, the RAC Air Health Monitor (AHM) was formed to support efforts in understanding the impacts of vehicle emissions and empower the community with access to easily comprehensible local air quality information.
The RACH AHM combines data from their Clarity air quality sensor network with an advanced Ramboll Shair model and information from traffic monitoring, meteorology, and industrial activity.

The RAC later added 10 Clarity Black Carbon Modules to existing Node-S air quality sensors across the Perth and Peel region. Module locations were identified based on where daily PM2.5 and NO2 air pollution exceedances were already being observed during 2022 and 2023. These locations were near pollution hotspots such as major highways and busy roadways. The RAC hoped that the black carbon monitoring would help identify whether black carbon emission patterns followed traffic-related air pollution trends.
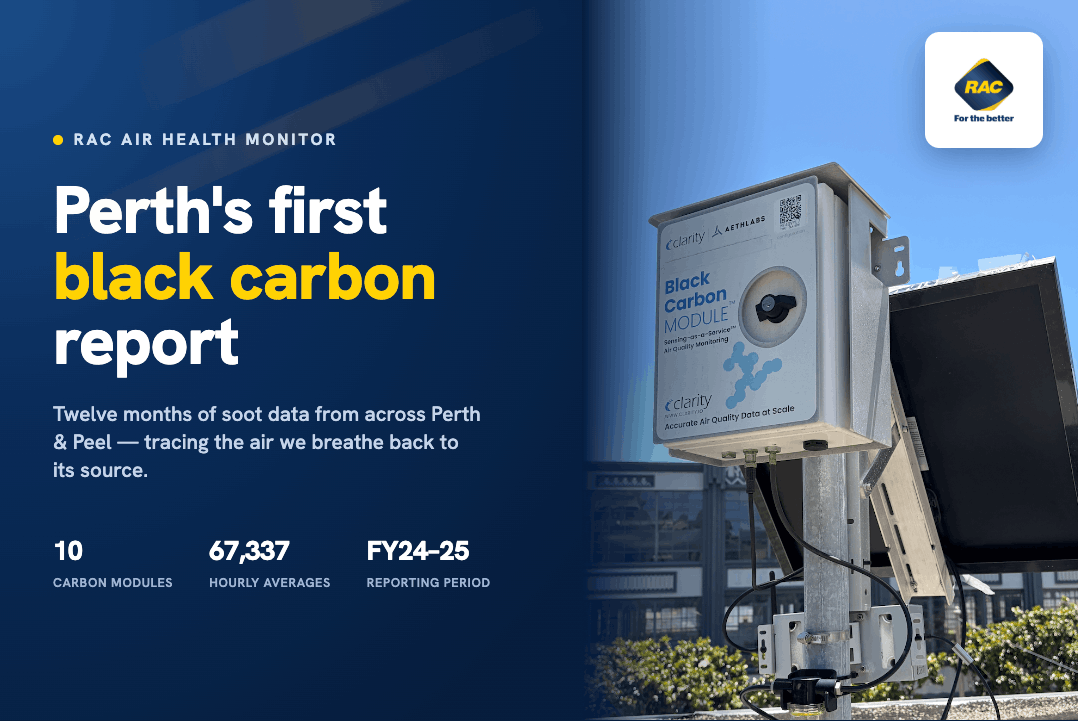
The RAC developed a report based on data from the first 12 months of black carbon monitoring in the region, from July 2024 to June 2025.
Key findings from the black carbon Perth report
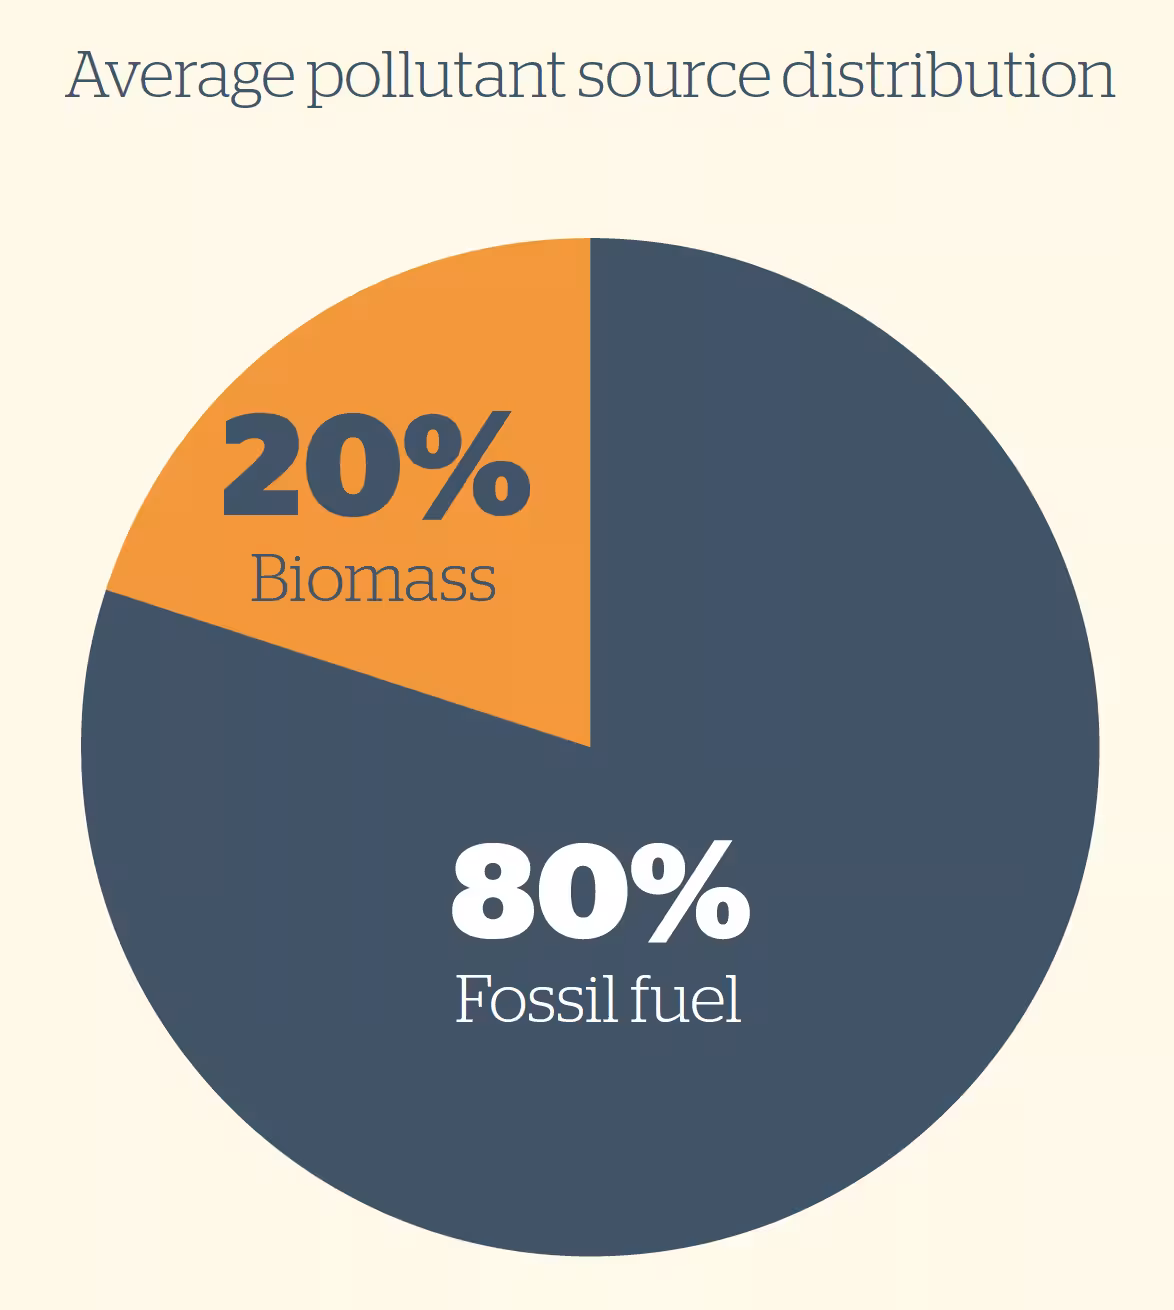
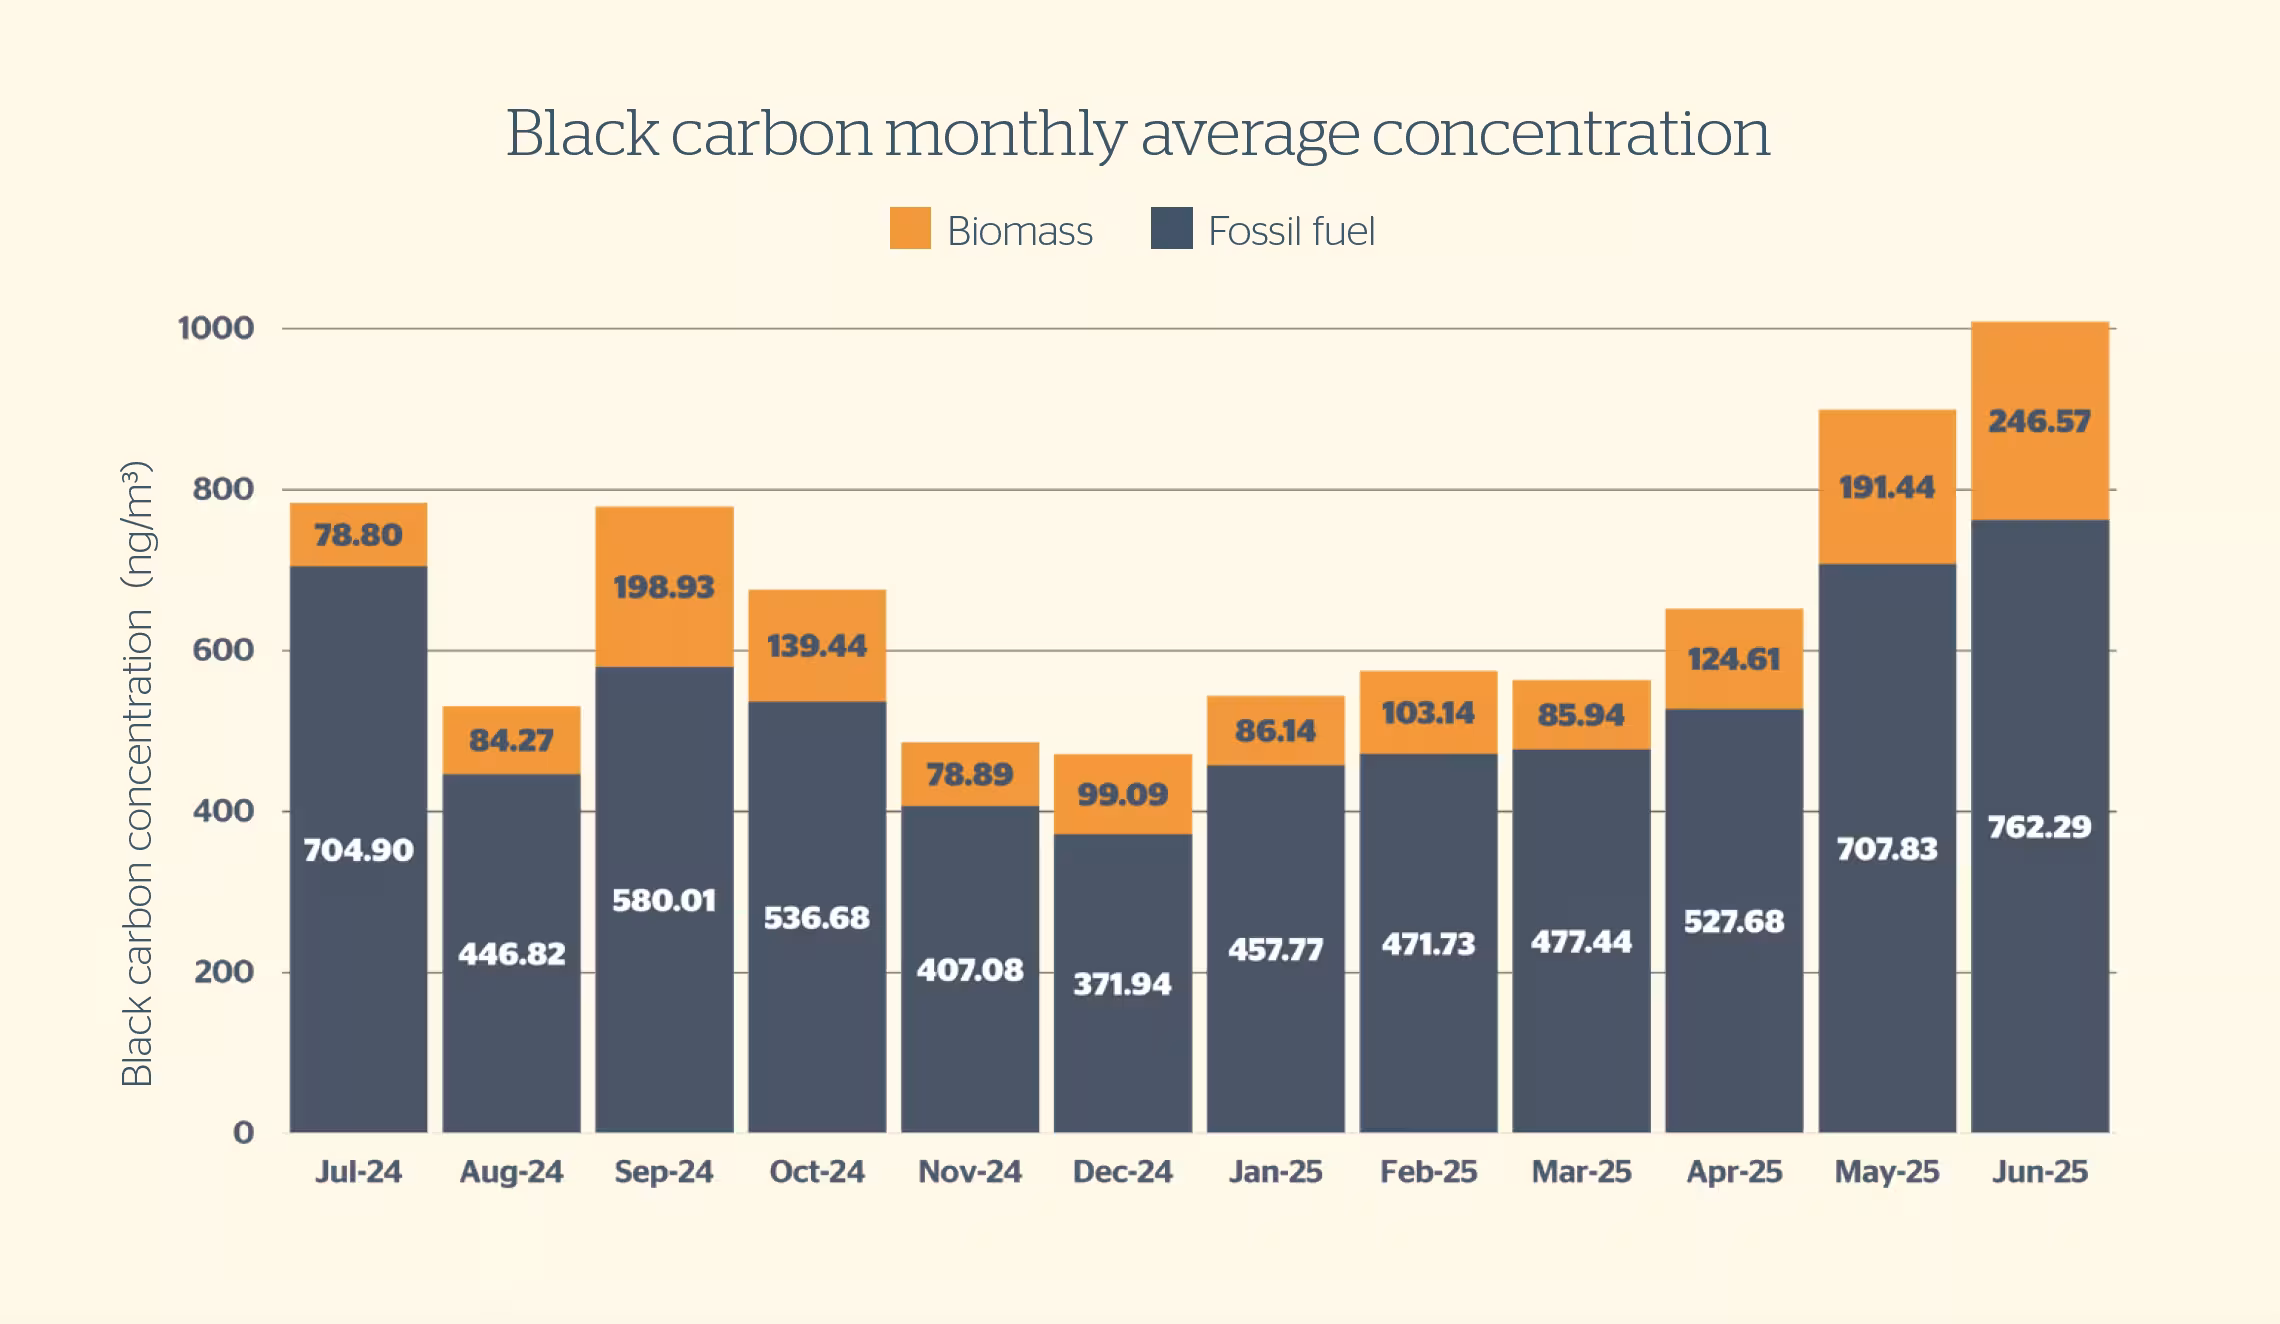
The black carbon monitoring report included analysis of 67,337 hourly averages and revealed key insights into local air pollution sources. Across the whole network, fossil fuels were observed as the predominant average pollutant source distribution compared to biomass burning.
The report also uncovered important data about fluctuations in emissions over time. Black carbon concentrations in the atmosphere are determined by a combination of human behavior, seasonal biomass burning, and weather conditions. For instance, lower wind speeds allow pollutant concentrations to build, while stronger winds tend to disperse them.
Different times of year yielded different black carbon levels. For instance, pollution concentrations lowered in December 2024, reflecting the summer holiday, which is a low commuting period. Whereas May and June 2025 saw concentration spikes because cooler temperatures reduced atmospheric mixing and stable air trapped emissions near the ground. Autumn through June additionally saw a rise in black carbon air pollution levels from bushfires, residential wood burning, and other biomass sources.
Weekly and hourly black carbon concentrations
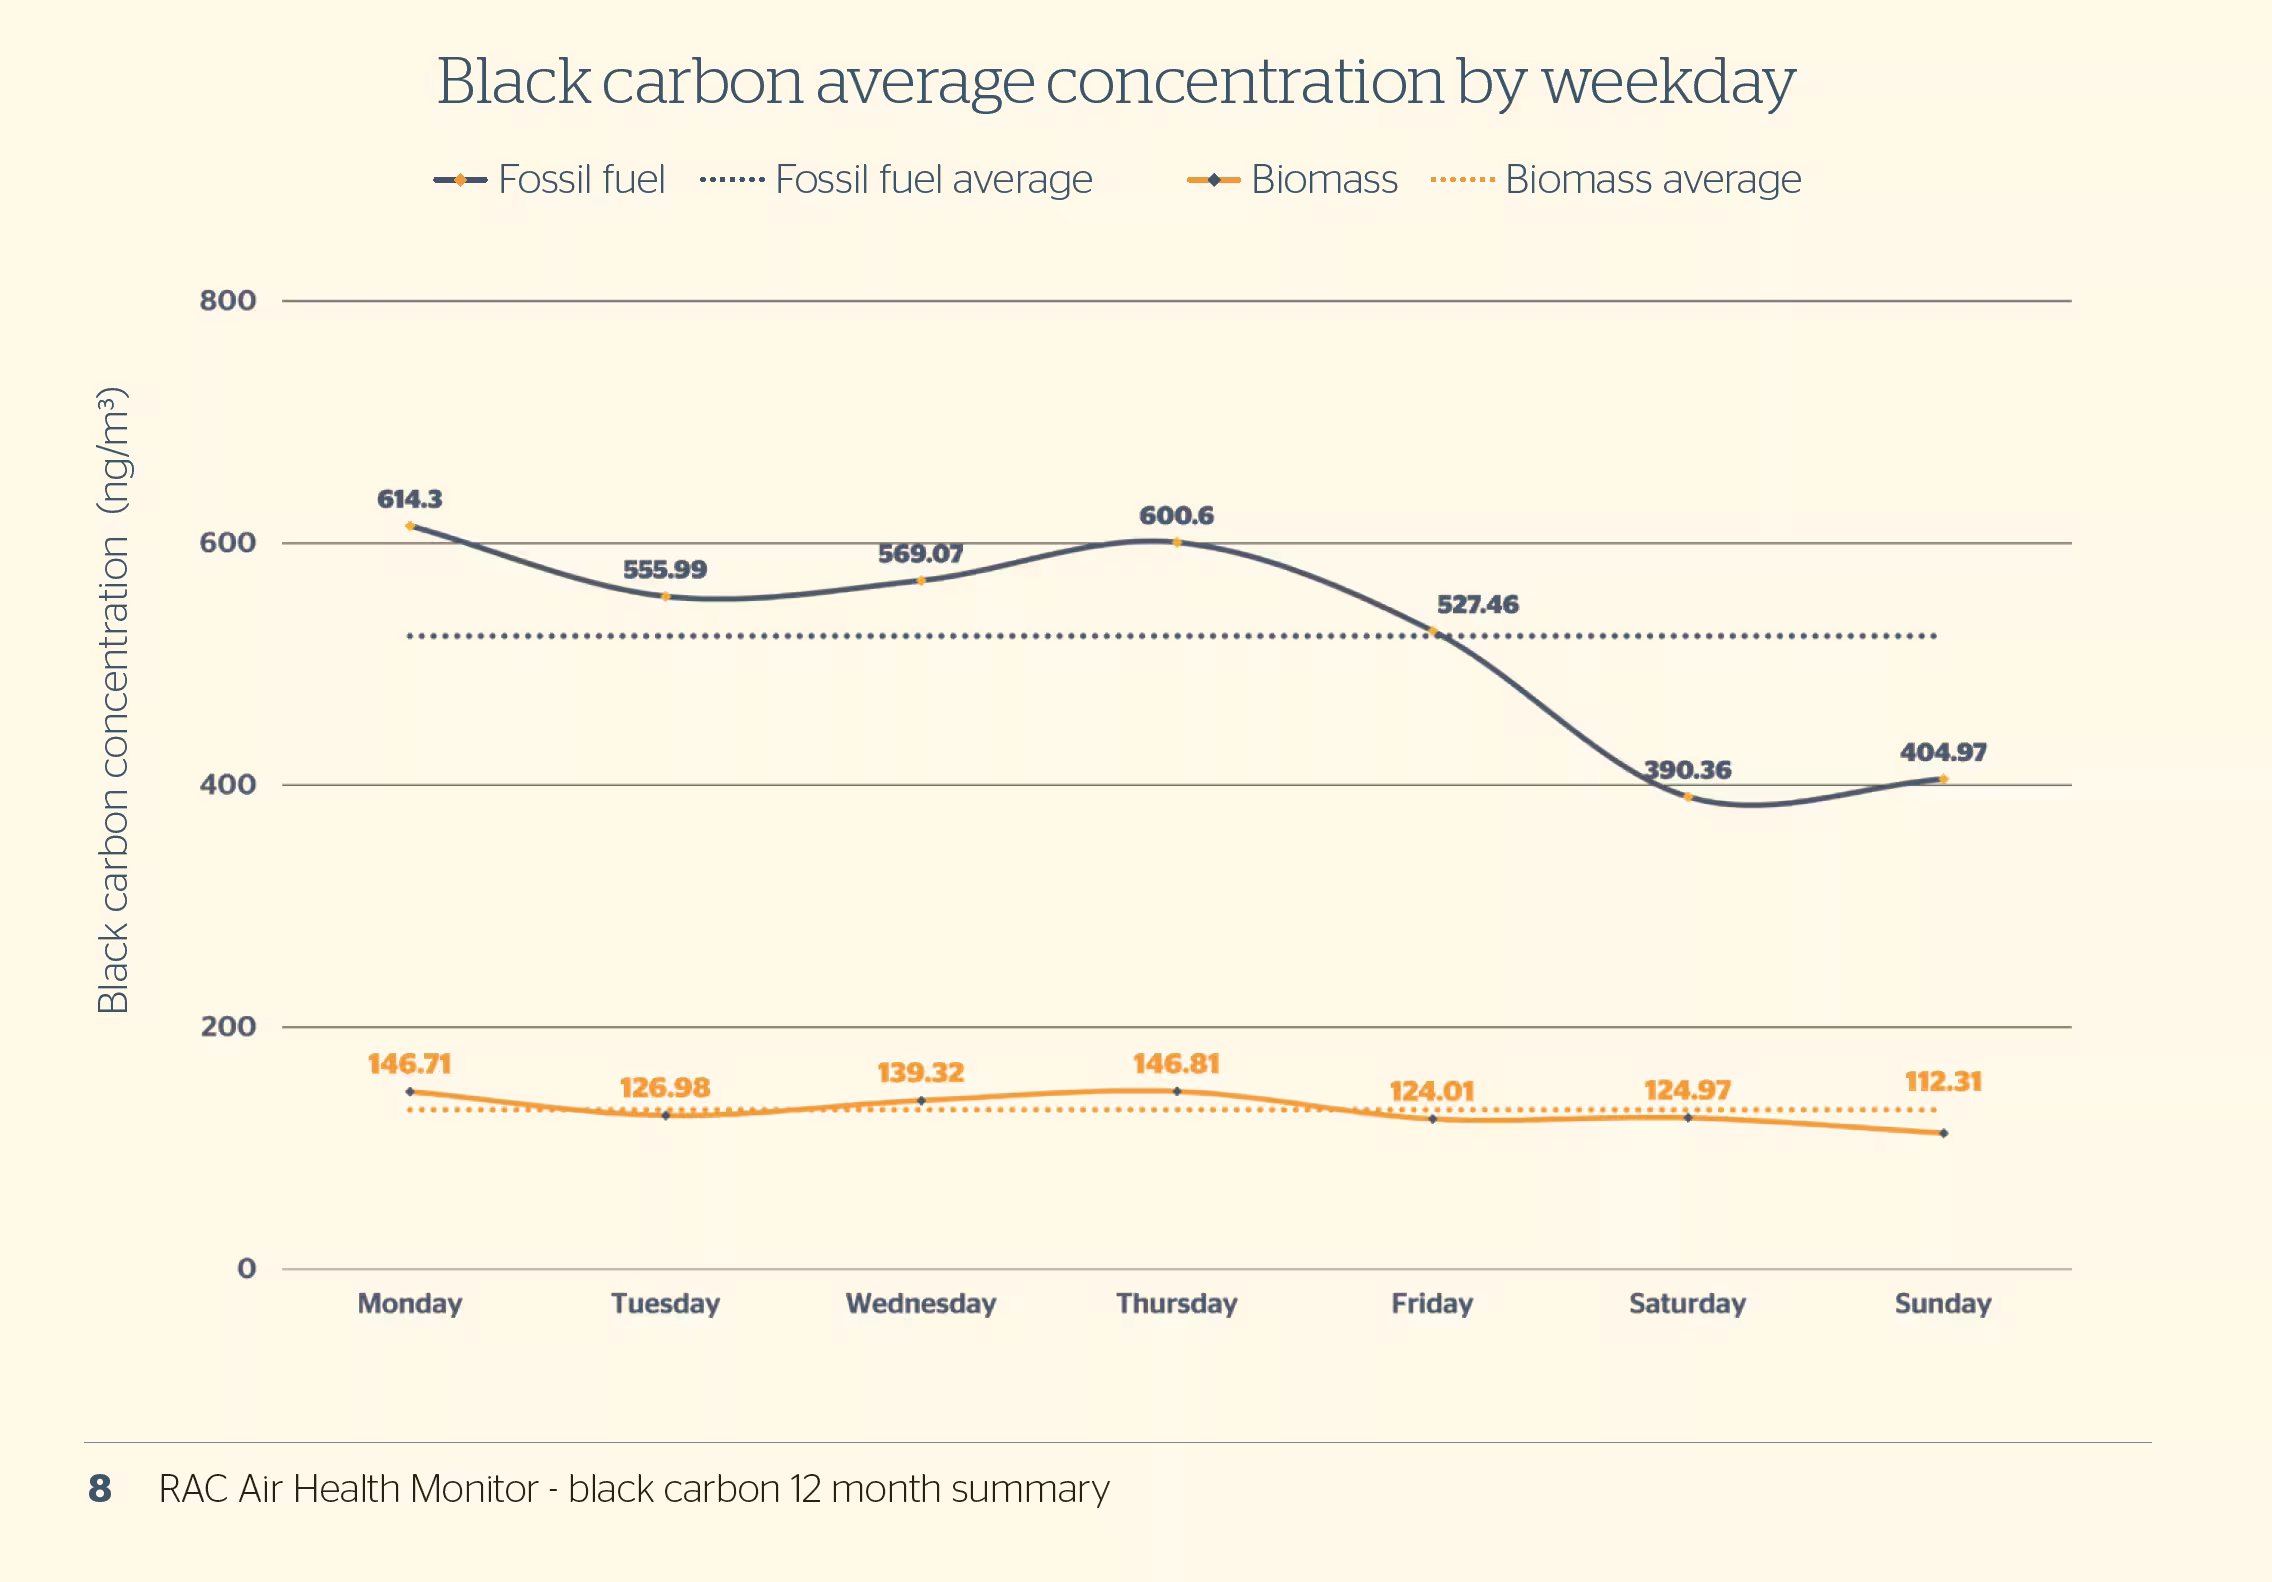
The weekday pattern of black carbon air pollution is tied to commuting and weather patterns. Concentrations from fossil fuel sources are 30.6% lower on weekends on average, reflecting the reduction in commuter traffic. Pollution concentrations sourced from biomass burning are more consistent across different weekdays.
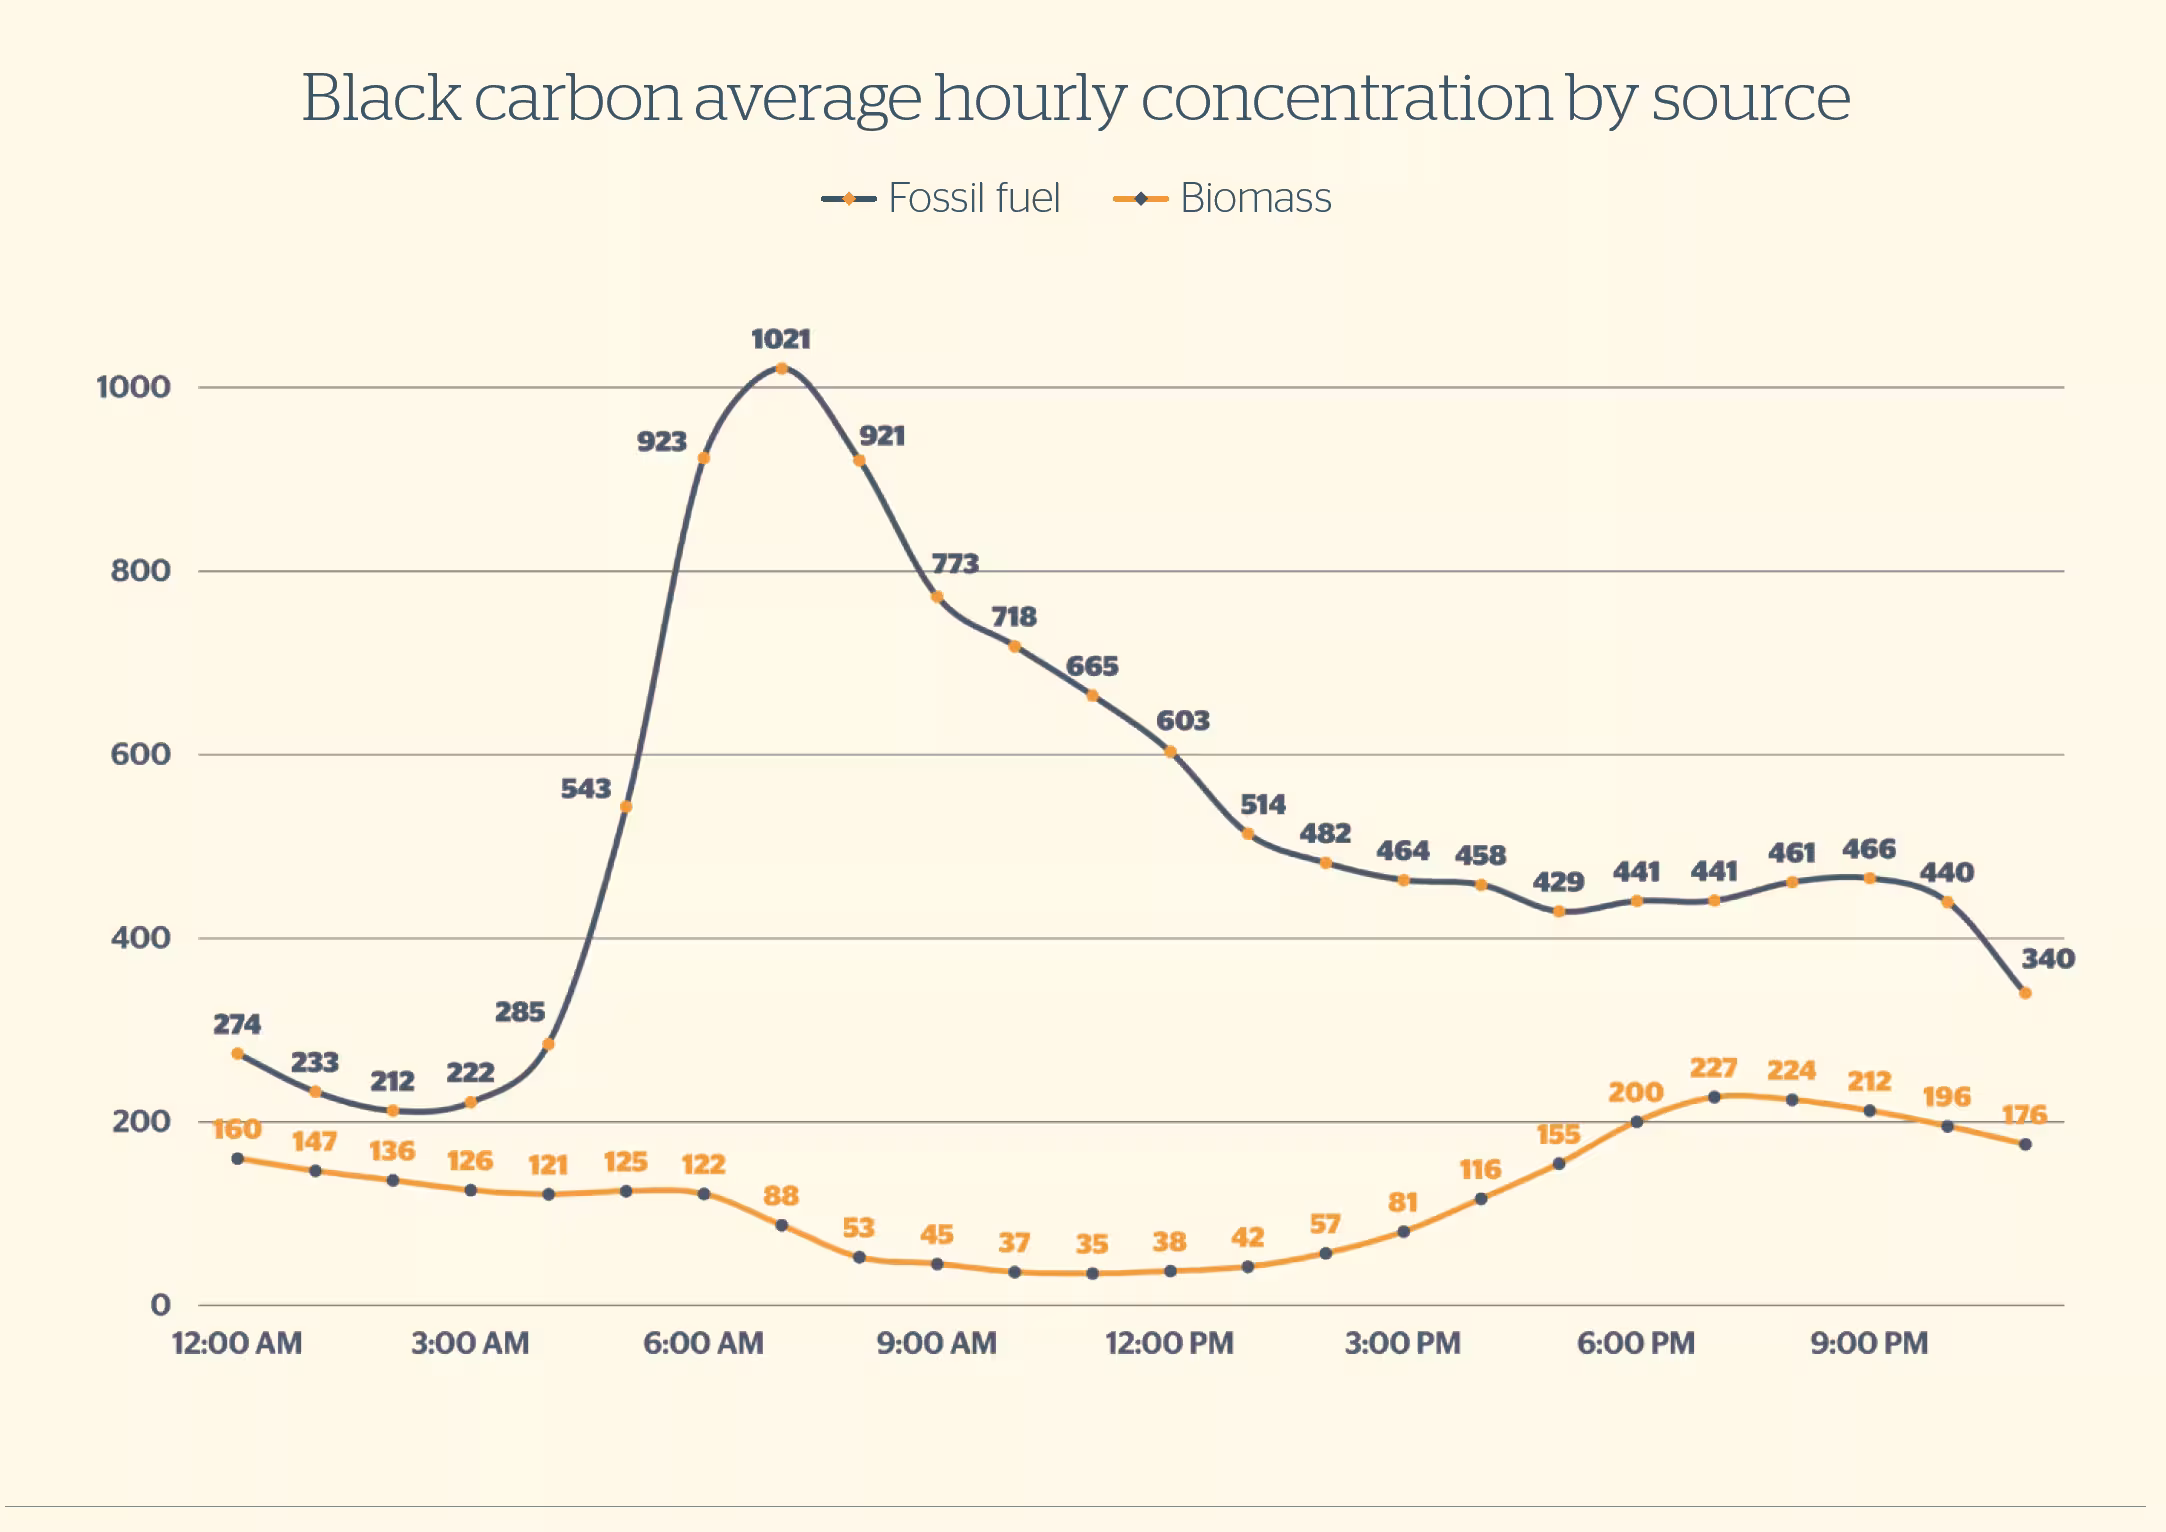
The report also revealed interesting findings on the hourly concentrations of black carbon. BC air pollution levels tend to rise before sunrise, reflecting the first commuter wave. During this time, there is a shallow and stable boundary layer that traps emissions near the ground. Early morning emissions are exacerbated by diesel-powered heavy trucks, buses, and commercial vehicles.
Later throughout the day, pollution levels begin to fall despite consistent traffic. This is because, as the sun warms the ground, the boundary layer deepens, and pollutants disperse more effectively. By the afternoon, even though there is another increase in traffic, the atmosphere is well-mixed and disperses this second round of emissions more quickly.
Looking forward
Data from Black Carbon Modules has allowed RAC WA to enhance its understanding of localized air pollution and understand its disproportionate impacts. The monitoring efforts have shown a strong correlation between traffic emissions and black carbon levels, reinforcing the need to reduce traffic-related air pollution emissions.
Air quality monitoring provides the data necessary to reinforce clean air advocacy and public health policy. It supports informed discussion and decision-making. Partner with Clarity to implement an advanced air quality sensor network and explore our complete air pollution monitoring ecosystem, including the Black Carbon Module and other offerings.