Part of the Image provided by Bradley Dunn via Unsplash.
TL;DR: PM2.5 and PM10 are both inhalable particulate matter, but they differ in several key ways, including potential travel distances and some health effects. Everyday sources of particulate matter include vehicle exhaust, wildfire smoke, construction, and road dust. Monitoring both sizes, measured against WHO and EPA thresholds, gives a fuller picture of the air communities breathe.
Terms explained: PM, PM2.5, and PM10
PM stands for particulate matter; however, particulate matter can come in many different forms and sizes, which can be confusing. Fortunately, there are some classifications that help sort particulate matter and provide clarification.
What is particulate matter (PM)?
Particulate matter (PM) is not any one substance. It refers to any solid or liquid particles floating in the air. Particulate matter can include dust, pollen, ash, and more. While particulate matter exists in both indoor and outdoor air, this guide will focus on PM in ambient environments, where it can contribute to urban haze, smog, and wildfire smoke.
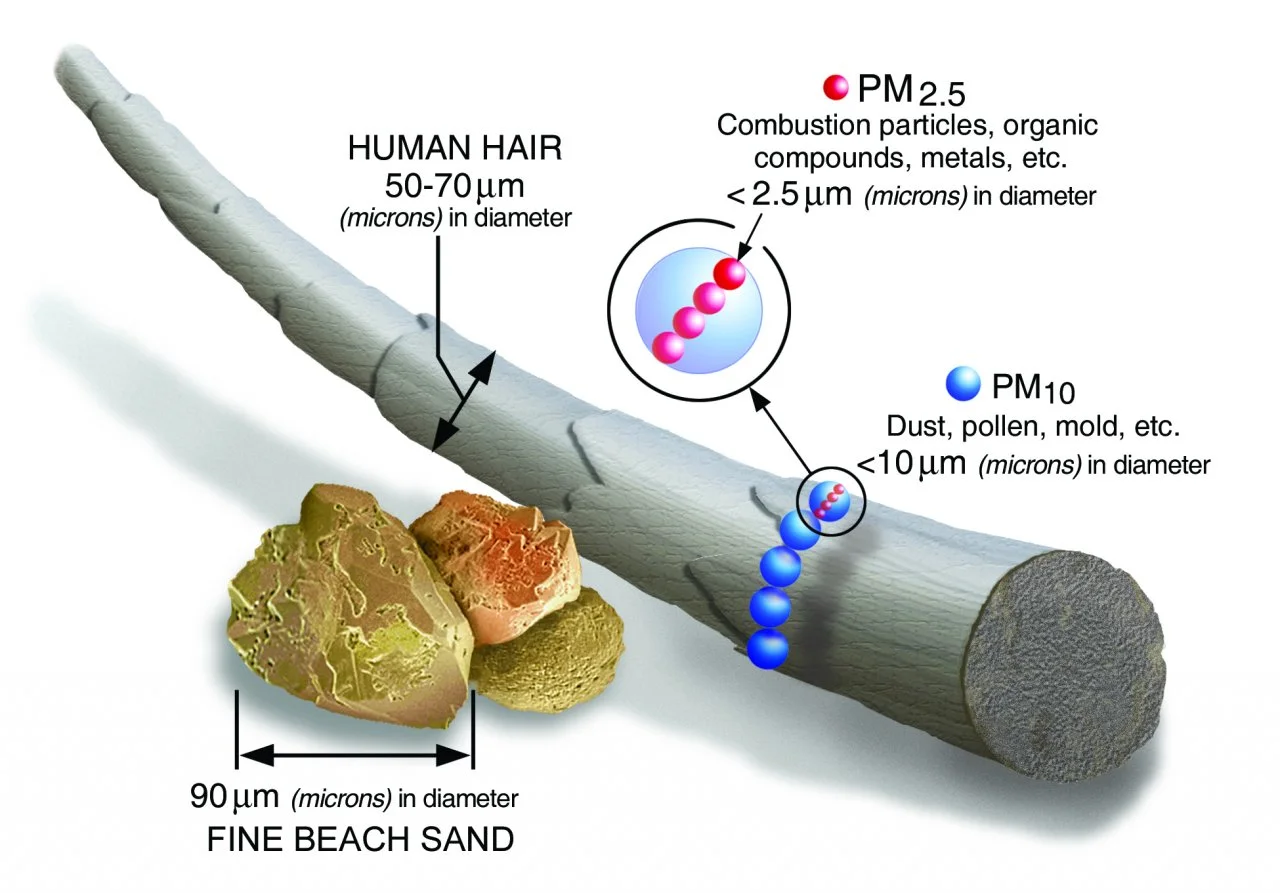
PM is usually accompanied by a number, such as 0.1, 1, 2.5, or 10. These numbers indicate the size of the particles being discussed. The smaller the number, the smaller the diameter of the particles in question. The main difference between PM10 and PM2.5 is size.
What is PM2.5?
Fine particulate matter, also known as PM2.5, refers to particles with a diameter of 2.5 micrometers (μm) or smaller. This is about 30 times smaller than a human hair. PM2.5 exposure contributes to about 5,400 premature deaths from cardiopulmonary causes every year in California alone.
What is PM10?
PM10 refers to slightly coarser particulate matter. PM10, commonly referred to as dust, consists of particles with a diameter of 10 micrometers (μm) or smaller. While many aspects of particulate matter are similar, PM10 differs from fine particulate matter in some of its sources, health effects, and atmospheric dispersion.
PM10 vs PM2.5: The key differences
Both PM10 and PM2.5 are small enough to be inhaled. PM10 particles are small enough to pass through the nose, throat, and even enter the lungs. Yet, smaller particles can more easily get past our bodies’ natural defenses. PM2.5 is small enough to enter deep into the lungs and get into the bloodstream. PM2.5 is associated with the greatest proportion of air pollution-related adverse health effects compared with other common air pollutants. Long-term exposure to PM2.5 contributed to over 4 million deaths globally in 2019.
PM10 and PM2.5 share many of the same sources. Combustion of gasoline, diesel fuel, oil, or wood burning produces both PM2.5 and PM10, but combustion particles are more likely to be fine particulate matter (PM2.5). Chemical reactions in the atmosphere between PM2.5 precursors, such as nitrogen oxides (NOx), sulfur dioxide (SO2), volatile organic compounds (VOC), and ammonia, can also contribute to the formation of fine particulate matter. These precursors are also often emitted by fossil fuel combustion among other sources. Secondary particles, formed from these chemical reactions, actually comprise most of the fine particulate matter air pollution in the U.S.
PM10 dust sources, on the other hand, primarily come from activities that involve cutting, grinding, or blasting materials. Anthropogenic sources include construction, agriculture, landfills, industrial sources, mining, and waste burning. PM10 can also come from natural sources such as wildfires, sandstorms, pollen, and any particles kicked up by strong winds.
PM10 particles are slightly heavier than their smaller PM2.5 counterparts. This causes PM10 particles to fall to the ground rather than disperse into the atmosphere. PM10 can stay suspended for minutes to hours and travel from 100 yards to a maximum of around 30 miles. On the other hand, PM2.5 can remain in the atmosphere for days to weeks and travel hundreds or thousands of miles. Yet, PM10 might linger on the ground for longer periods of time. In the wake of wildfires, PM10 in the form of ash can stick around long after the fire is extinguished.
Examples of PM2.5 and PM10
Particulate matter air pollution is common in everyday life, and it’s normal to be exposed to a certain amount of particulate matter in daily life. Examples of common sources for PM2.5 and PM10 air pollution can be found below.
Common sources of PM2.5 include:
- Vehicle exhaust
- Industrial combustion
- Wood burning
- Smoking
- Smog and haze
- Wildfire smoke
Common sources of PM10 include:
- Construction dust
- Mining
- Sand storms
- Agriculture
- Industrial activities
- Road dust (especially from unpaved roads)
PM2.5 and PM10 safe levels: WHO and EPA guidelines
There are no “safe” levels of air pollution. However, certain thresholds exist to minimize air pollution risk. These thresholds include the World Health Organization (WHO) guidelines and the Environmental Protection Agency (EPA) National Ambient Air Quality Standards (NAAQS).
How PM2.5 and PM10 are measured
Several methods can be used to monitor particulate matter. Federal reference methods (FRMs) use the gravimetric method. These provide the most accurate measurements, but they are labor-intensive and expensive.
Federal equivalent methods (FEMs), such as beta attenuation monitors (BAMs), are deemed sufficiently close to FRMs in accuracy. BAMs use beta rays to measure PM by measuring how much beta particles are attenuated as they pass through the particulate matter.
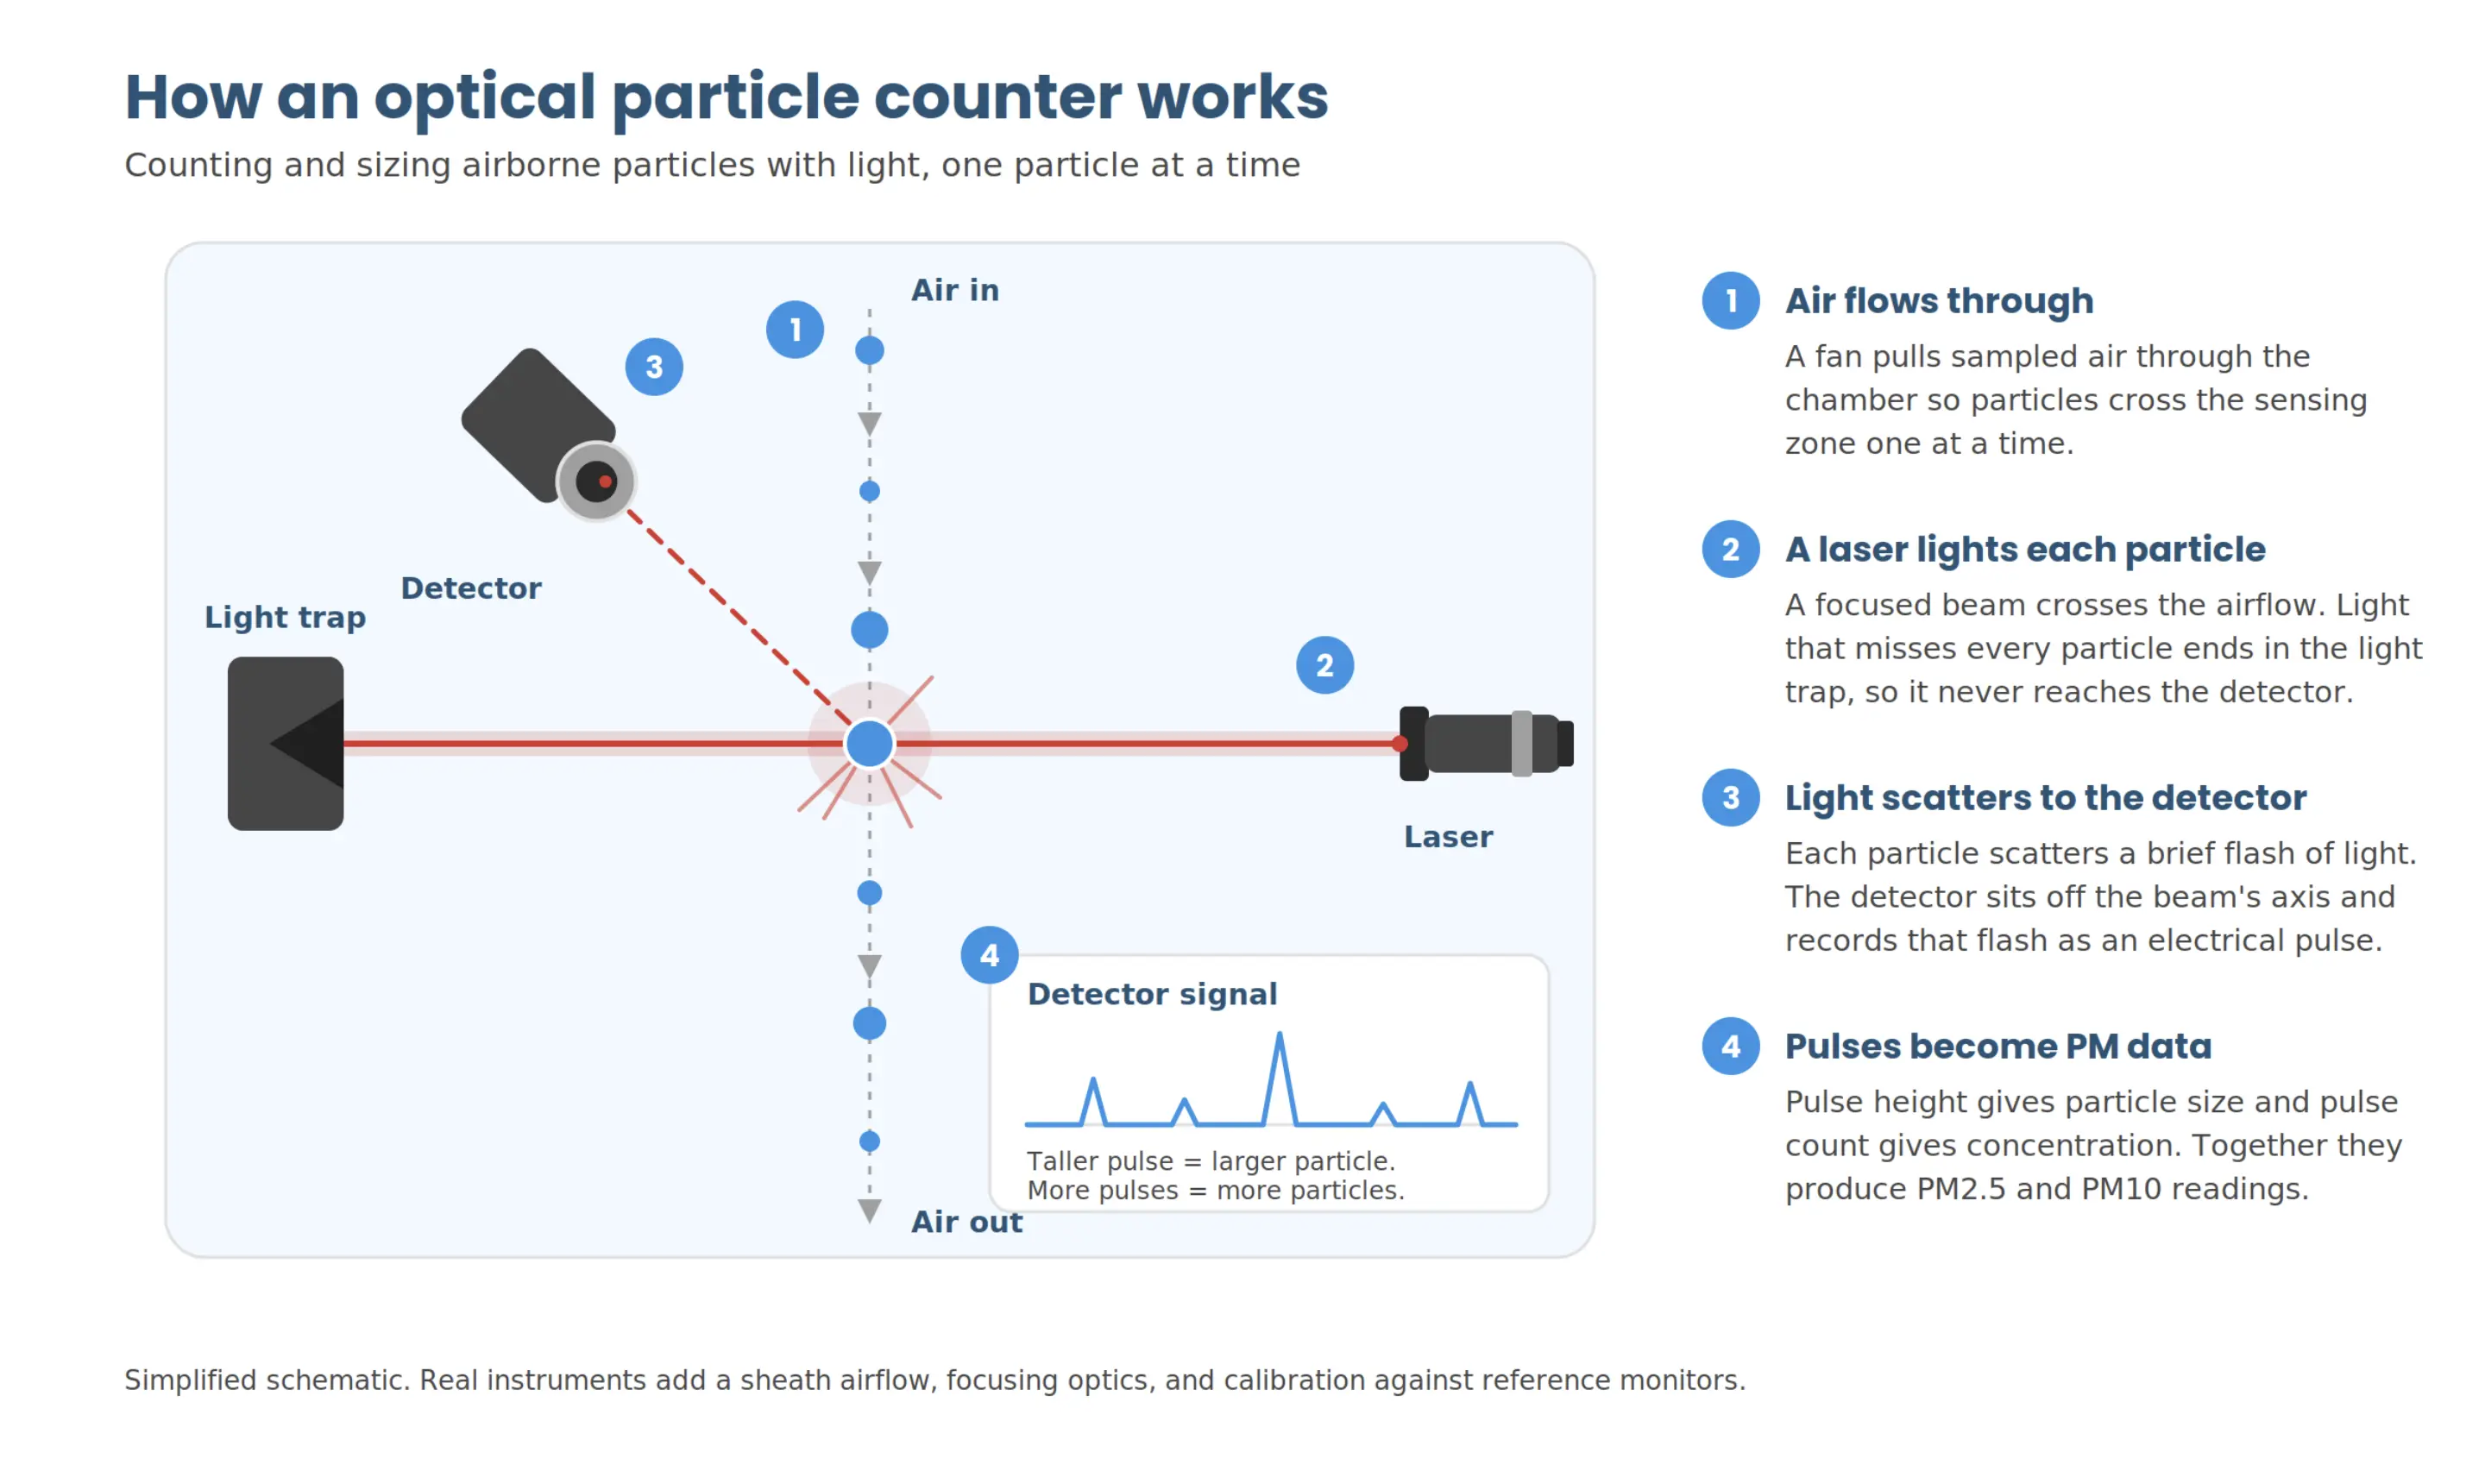
Optical particle counters (OPCs) are frequently used in low-cost air quality sensors. This technology uses a light source to illuminate PM as it passes through a detection chamber. Detectors count and size the particles based on how they scatter the light.
Nephelometric sensors are similar. However, they estimate mass particulate concentrations from bulk scattered light, rather than count individual particles.

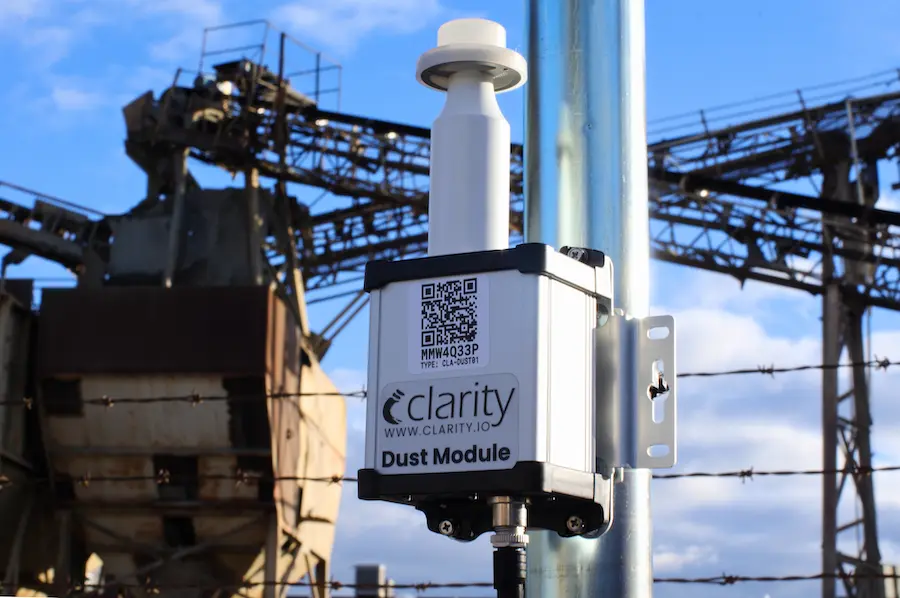
Most low-cost particulate matter air quality sensors, including the Node-S, are incapable of directly measuring PM10 and therefore estimate PM10 levels based on present PM2.5 levels. While this might be sufficient for typical ambient concentrations, this method is not as reliable in environments with elevated concentrations or certain weather.
Construction zones and certain industrial sites, for instance, may require more dedicated PM10 monitoring, as demonstrated by the 2025 IAQM position statement in the UK.
To recap, particulate matter can be monitored with the following:
- Federal reference methods and periodic sampling
- Federal equivalent methods
- Low-cost sensors for continuous, real-time monitoring
- Optical sensing methods that measure different PM sizes together, estimating one based on the other
- Enhanced optical detection and heated inlets for elevated PM10 monitoring
Real-world examples: PM monitoring in practice
Clarity has several case studies with monitoring both PM2.5 and PM10.
Measuring PM2.5: Brightline Defense
In 2020, the non-profit Brightline Defense deployed an air quality monitoring network in San Francisco. The network initially consisted of 15 Node-S sensors measuring PM2.5 and NO2, then expanded to 19 in response to community demand. The network helped protect local communities by supplying important air quality data during wildfires.
Having a self-sufficient device like the Clarity Node-S was key for rapid deployment during the wildfire events. Our nonprofit installed 19 monitors in less than 2 months. We were making emergency requests to city agencies, nonprofit affordable housing developers, and local businesses to gain access to their facilities or rooftops to install these devices. I can only imagine how much more difficult it would have been if we had to arrange access to Wi-Fi networks for connectivity or electrical outlets for power — fortunately, the Node-S is hearty, weatherproof, solar-powered, and operated by a cellular network.”
— Eddie Ahn, Executive Director of Brightline Defense
Measuring PM10: Yerevan, Armenia
The Yerevan Mayor’s Office and TMCYC partnered with Clarity to deploy about 170 air quality sensors throughout the city, so that each major construction site has at least two air quality sensors. This network allows the Municipality’s Department of Environmental Protection to quickly detect and address dust levels that exceed regulations. With the air quality data open to the public, residents are better able to comprehend and protect themselves from air pollution dangers.
Clarity’s innovative technology has significantly improved our understanding of urban air pollution and its impact on public health and the environment. The system’s accuracy, reliability, and user-friendly interface have proven to be extremely effective tools for both decision-makers and the public. It provides real‑time, accessible data that enables informed policy development and empowers citizens with the knowledge to take action. This initiative has been highly appreciated by local authorities, environmental specialists, and the general public.”
— Sargis Manukyan, Director of the Technology Management Center of Yerevan City
Monitoring PM2.5 and PM10 with Clarity
Monitoring both PM2.5 and PM10 helps protect communities and the environment. Air quality monitoring is the first step toward improving the air we breathe. Partner with Clarity to start monitoring particulate air pollution and ensure clean air for all.